


Marginal ROAS vs CRO: The Actual Math on Your Next $5,500 a Month
That's what a dollar of Meta media leaves you at a 3:1 ROAS and a 45% gross margin, once you add ten cents of agency fees and creative for every dollar of media. Three dollars of revenue, $1.35 of gross profit, minus the $1.10 it cost.
Now two requests land on the same desk. Marketing wants 10% more for Meta. The Meta line is $55,000 a month including fees and creative, so that's $5,500, all in. A CRO proposal asks for the same $5,500 a month.
Same money, same month. The rest of this piece puts both requests through the same four questions.
- Why most CRO vs ad spend math compares the wrong numbers
- Question 1: what does the next dollar return?
- Meta, Google and CRO at the published medians
- Question 2: where does each one break even?
- Question 3: what happens when the money stops?
- Question 4: how sure can you be?
- Both requests in one table
- When to turn down both requests
- FAQ
Why Most CRO vs Ad Spend Math Compares the Wrong Numbers
Meta says as much in the documentation for Robyn, its own open-source marketing mix model: "each additional unit of advertising investment increases the response at a declining rate." Robyn calls the return on that extra unit the "next dollar response". It's the only return that matters when you're deciding whether to spend more.
Yes, ads are easier to see. Ads Manager shows a ROAS every morning, while a CRO test takes a month to read. But the number on that dashboard describes the money you've already spent. The next $5,500 has its own return, and no dashboard shows it until you've spent it.
So compare the next dollar of ads with the next dollar of CRO. The people who ask what the next dollar returns tend to make better budget calls than the ones who add 10% because the average looks good.
Question 1: What Does the Next Dollar Return?
Here's the ad side in one line:
Profit per ad dollar = marginal ROAS × gross margin ÷ (1 + fees) − 1
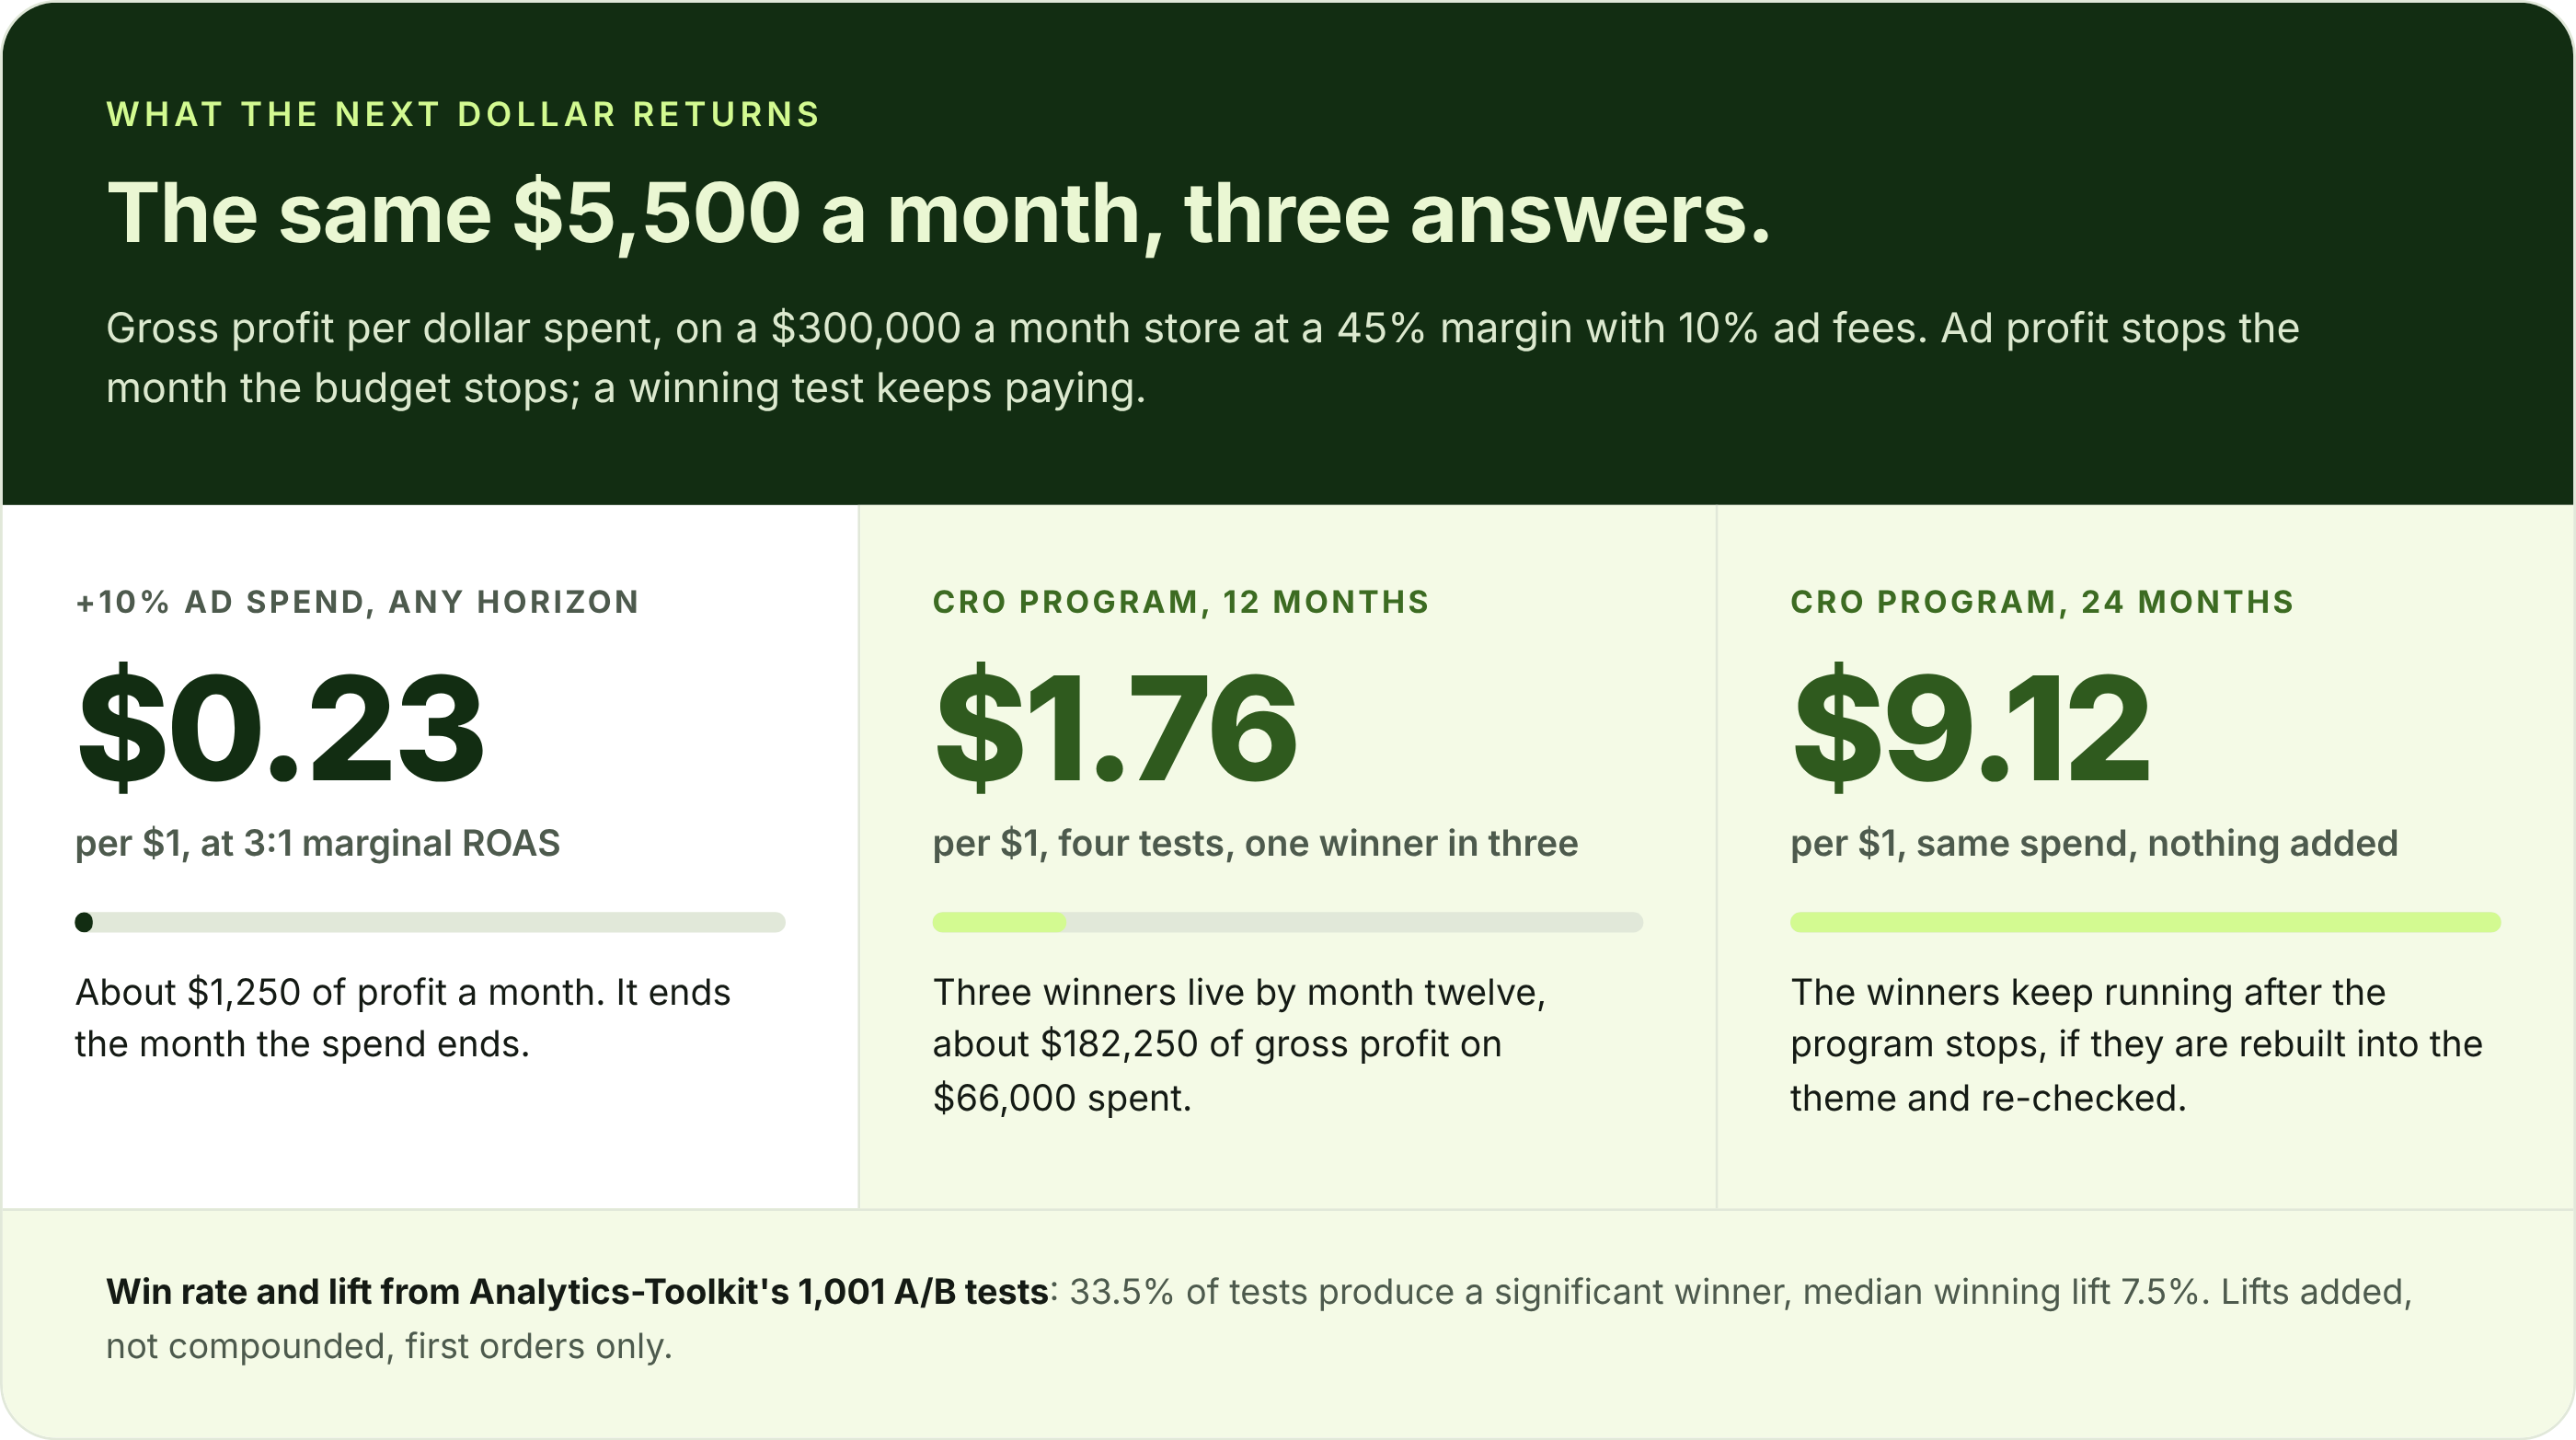
At 3:1, a 45% margin and 10% fees, that's 3 × 0.45 ÷ 1.10 − 1, or about $0.23 for every dollar, the same $0.25 on every $1.10 you started with. On $5,500 a month, it's about $1,250 of profit.
Now suppose the extra 10% comes back at 2.5:1 instead. The profit on the same $5,500 falls to about $125 a month.
To find your own marginal ROAS, you need two comparable periods with different budgets:
Marginal ROAS = change in ad revenue ÷ change in ad spend
Pick two months with similar seasonality and no big launches, where the Meta budget moved. If spend went up $8,000 and Meta-attributed revenue went up $18,000, the extra money came back at 2.25:1, whatever the dashboard average says.
On the CRO side, the same one-line logic applies:
Profit per CRO dollar = gross margin × added revenue over the period ÷ program cost − 1
To put a number on it, here's the store we'll use for the rest of this piece. It's the same one as in our breakdown of what one A/B test costs: $300,000 a month on 150,000 sessions, a 45% gross margin, a $5,500-a-month program for twelve months, $66,000 in all. The program runs one test a month on the templates every order passes through, the product page and the cart. One test in three wins, which is the share Analytics-Toolkit found across 1,001 real tests, and each winner lifts revenue by 7.5%, the median winning lift in the same data. Winners go live the month after they're read, so the first is live in month four, the second in month seven, the third in month ten and the fourth in month thirteen. Lifts are added, not compounded, and we count first orders only.
By month twelve, the winners have added about $405,000 of revenue. At a 45% margin that's $182,250 of gross profit on $66,000 spent, or about $1.76 for every dollar.
Meta, Google and CRO at the Published Medians
In Top Growth Marketing's DTC benchmark panel, the median purchase ROAS on Meta is 2.96, across 15 brands and $2.46 million of managed spend. On Google Ads it's 4.28, across 28 brands and $4.36 million. Both are account-level and platform-attributed, which means they count branded search, retargeting and every other cheap click in the account. The next dollar buys none of those, so treat the two numbers below as the ad side's best case rather than its likely one.
Through the same formula, at a 45% margin and 10% fees: Meta's median returns about $0.21 of profit per dollar out, Google's about $0.75. The CRO program on the same store returns $1.76 over twelve months.
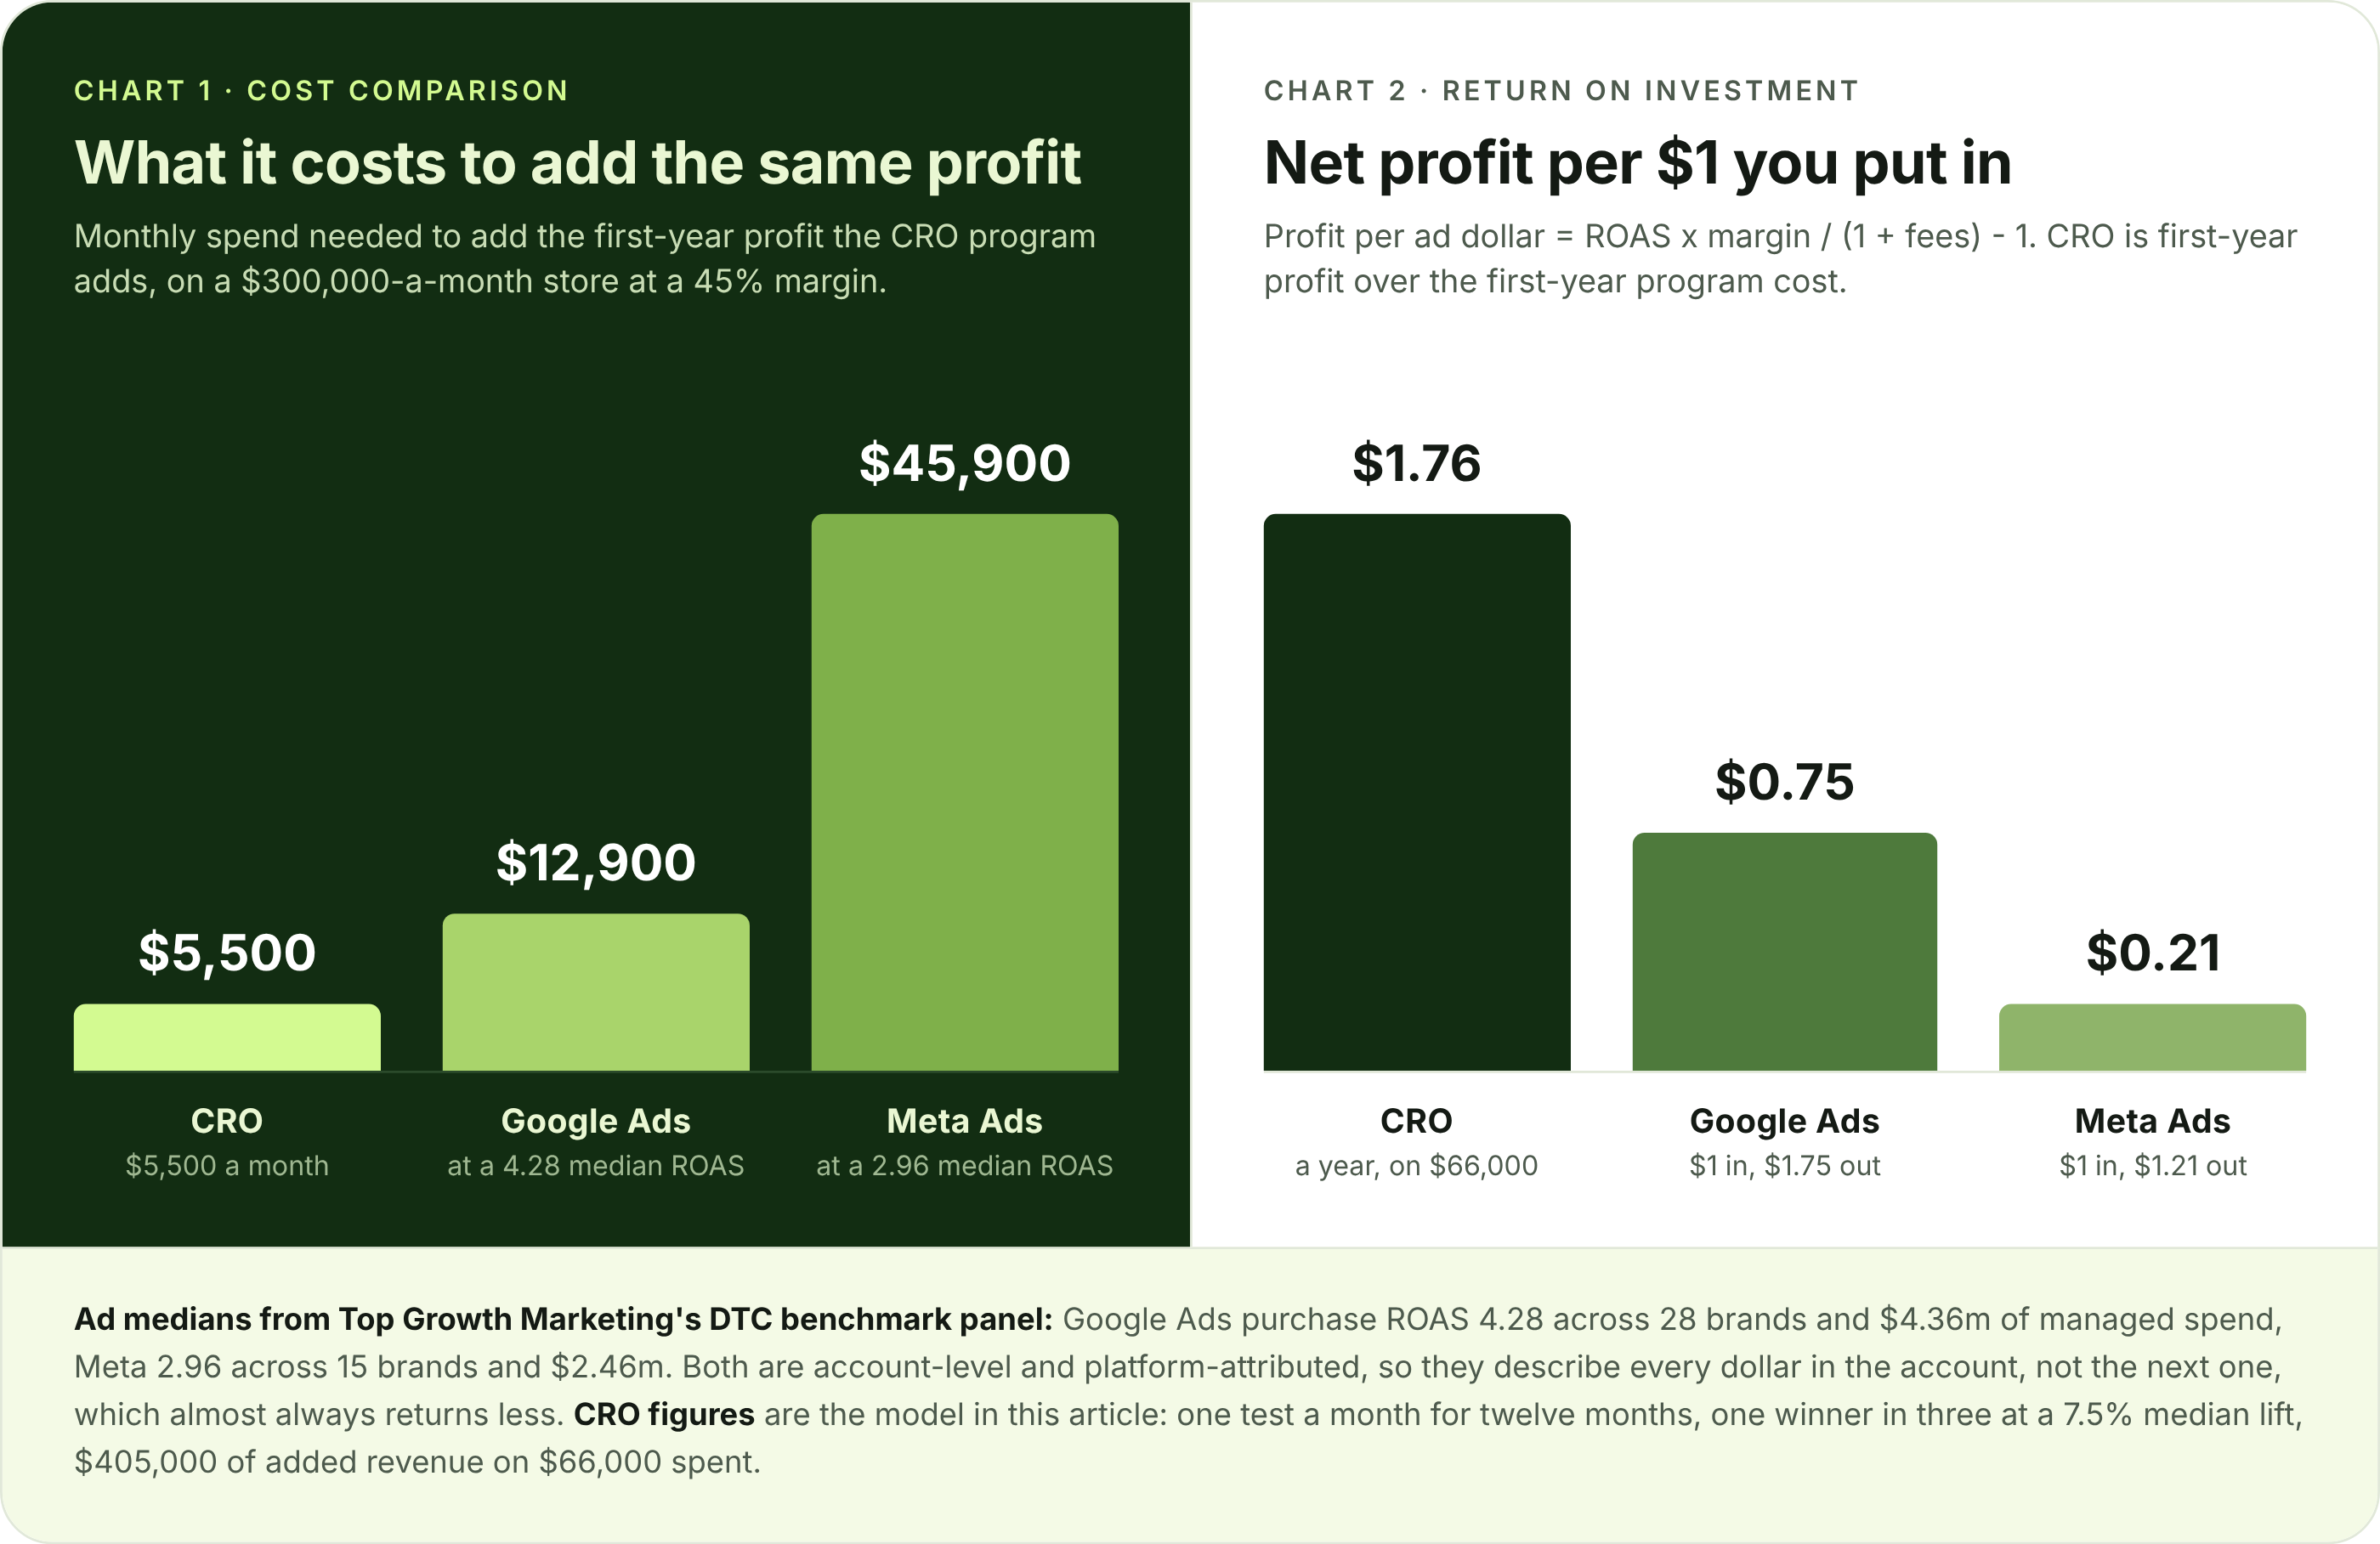
Turn it around and the gap is easier to feel. To add the same first-year profit the program adds, you would have to put about $12,900 a month into Google Ads at its median, or about $45,900 a month into Meta at its, against $5,500 a month for the program. That's before the next-dollar discount, which applies to both ad columns and to neither CRO column.
None of this says stop buying ads. The two aren't alternatives: a winning test on the page your ads land on raises the return on every ad dollar you were already spending, which is the next section but one.
Question 2: Where Does Each One Break Even?
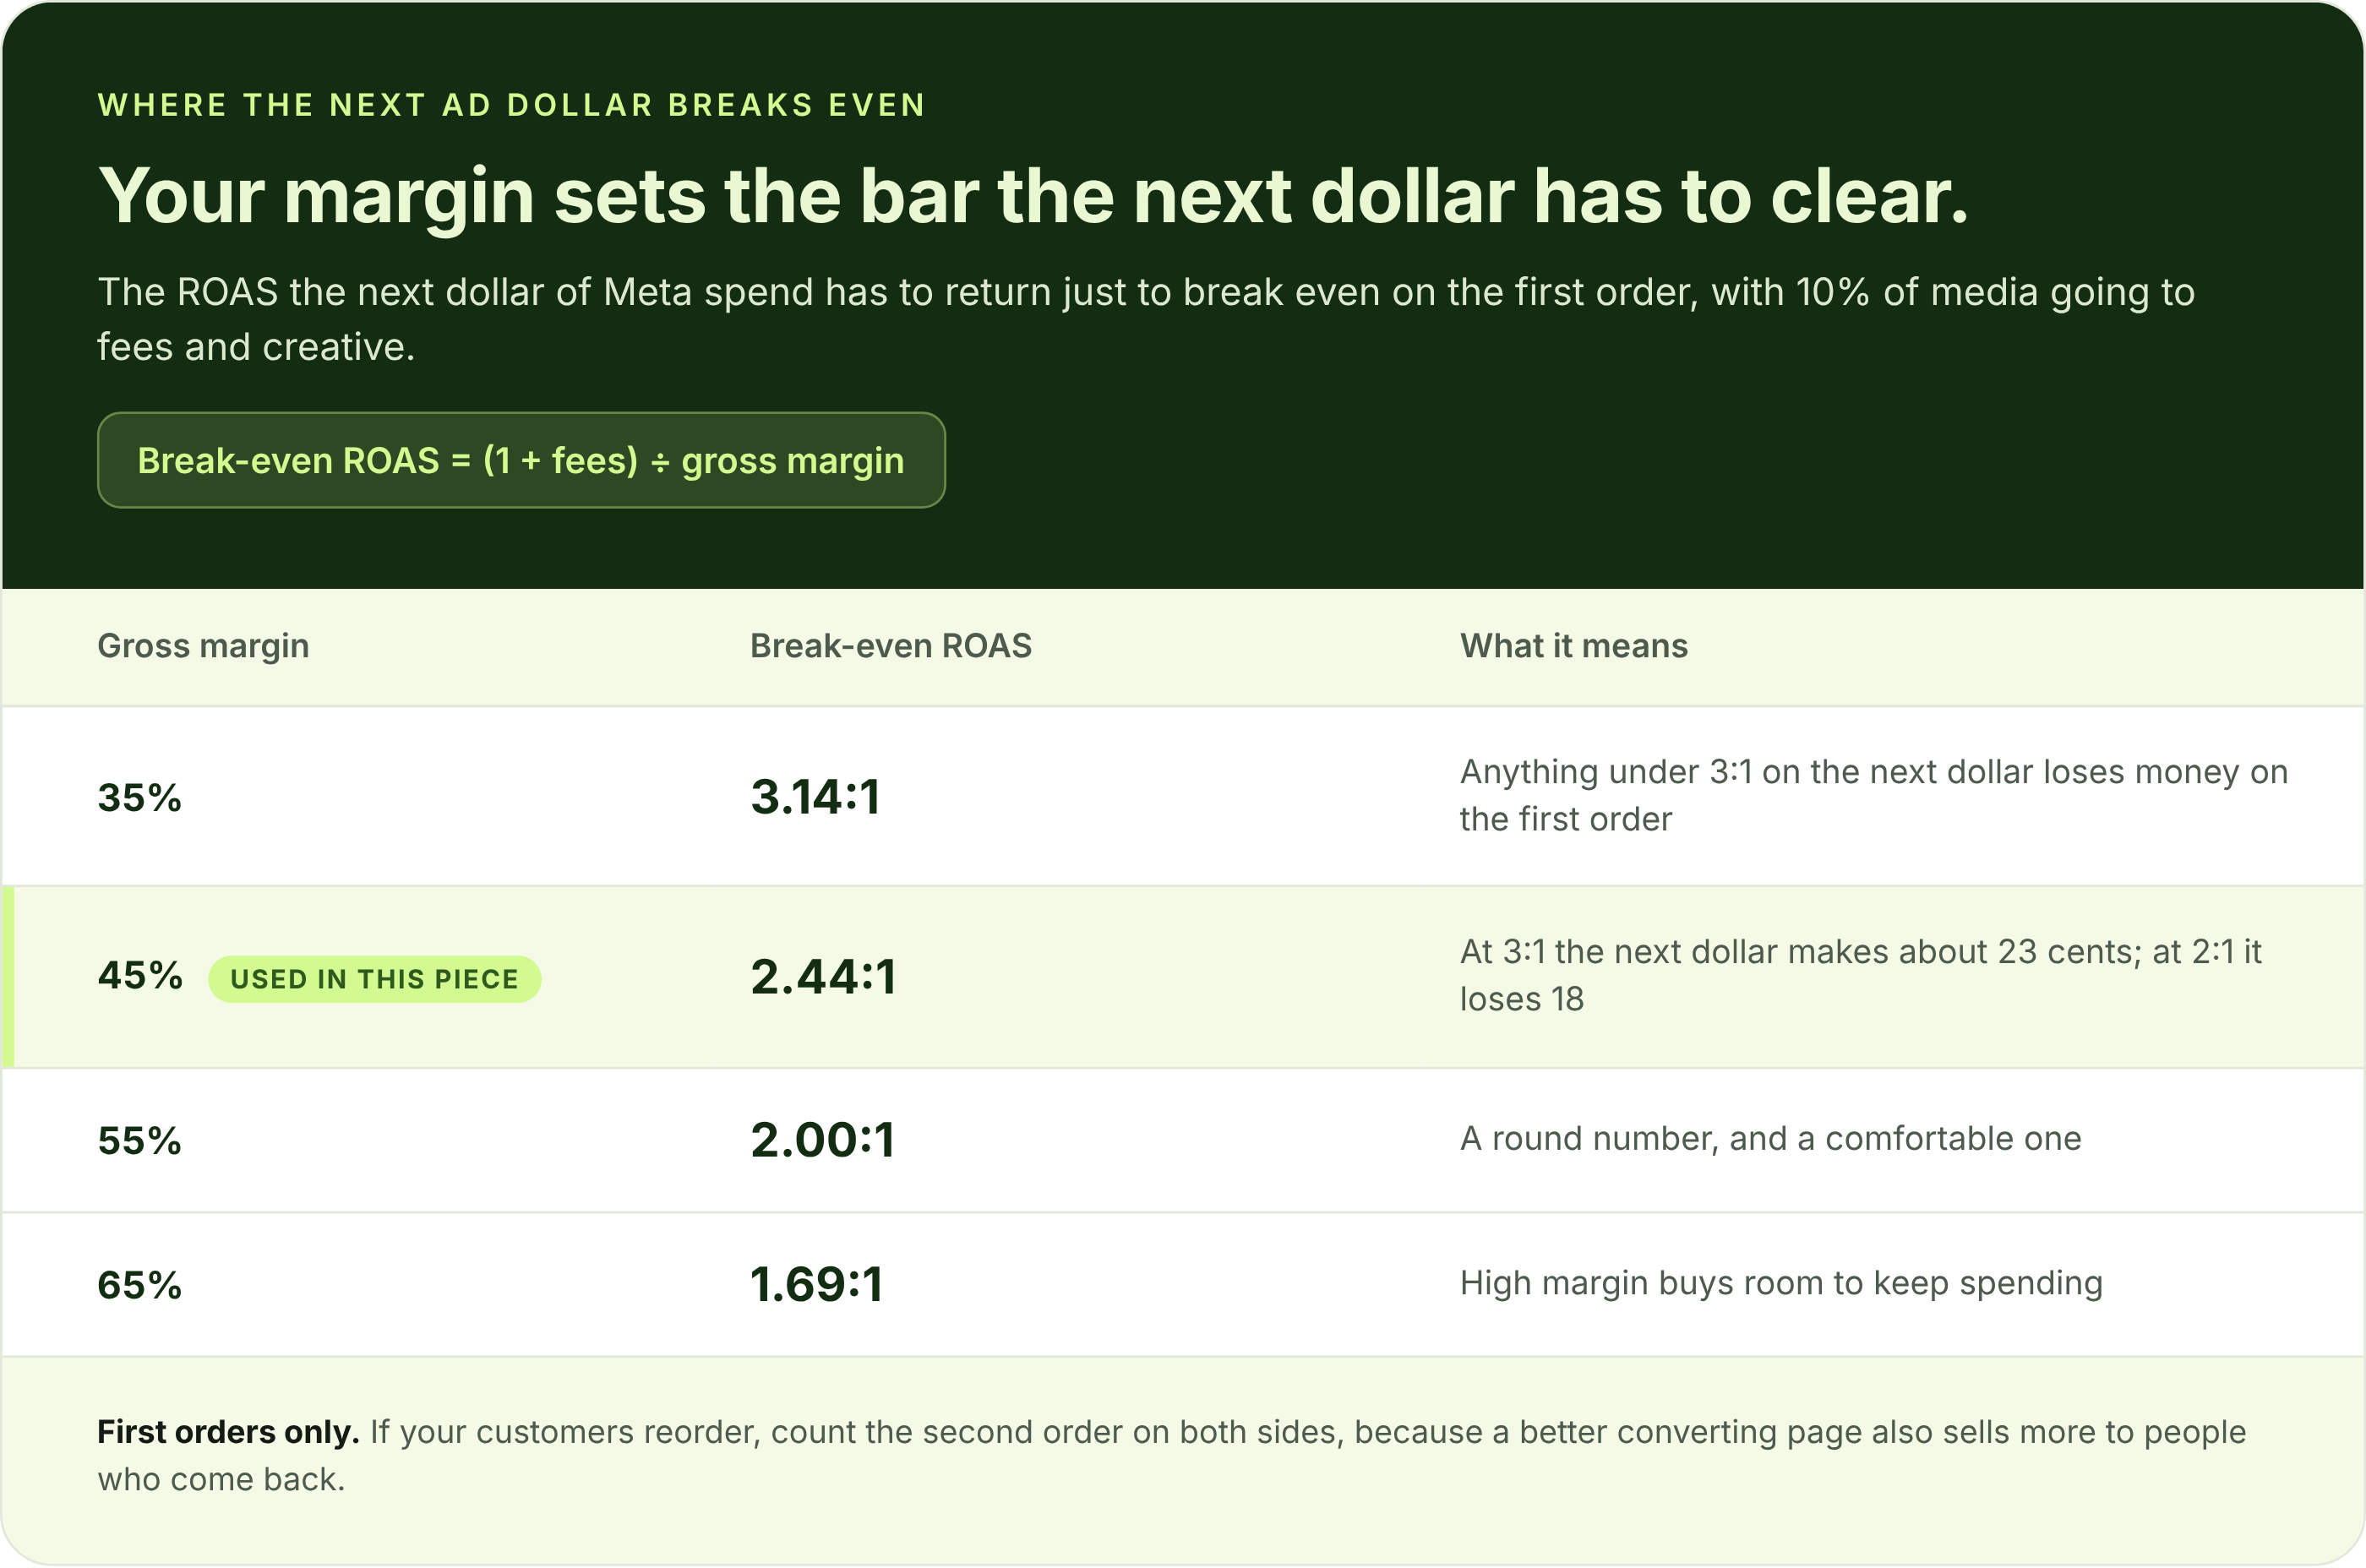
Break-even ROAS = (1 + fees) ÷ gross margin
For CRO, the break-even is a lift:
Break-even lift = program cost ÷ (gross margin × revenue through the tested pages over the months the winners are live)
On the same store, suppose the whole year produced a single winner, live from month four. To pay for the program by month twelve, that one winner has to lift revenue by $66,000 ÷ (0.45 × $300,000 × 9 months), or about 5.4%. If it stays live through month 24, the break-even lift falls to about 2.3%. Either is below the 7.5% a typical winner delivers, which is why a program can pay back on one winner.
Both formulas count first orders only. If your customers reorder, count the second order in both columns, because a better converting page also sells more to people who come back.
Question 3: What Happens When the Money Stops?
Run both requests for twelve months and then stop.
Month 1. The extra ad spend earns its $1,250 right away. The CRO program is still running its first test, so it has earned nothing yet.
Month 12. The ads have earned about $15,000 on $66,000 of spend. The CRO program has three winners live and a fourth about to ship, and has earned about $182,250 of gross profit on the same $66,000.
Month 24. The ad column hasn't moved since month 12. The four winning tests are still live on your pages and earned another $486,000 of gross profit between months 13 and 24, for about $668,250 in all, or $9.12 per dollar. That column assumes the winners hold for the full two years, which is the assumption doing the most work in this piece. Some lifts fade as the page around them changes, so rebuild the winners into your theme and re-check them.
There's one more effect that doesn't show up in either request. A winning test on the pages your ads land on lifts the return on every ad dollar you already spend. A 7.5% lift turns a 3:1 ROAS into roughly 3.2:1 on that traffic, and you don't pay a cent more for it.
Effective ROAS after a lift = ROAS × (1 + lift)
That's the median winning lift, by the way. In Georgi Georgiev's analysis of 1,001 A/B tests at Analytics-Toolkit, the tests that produced a significant winner had a median lift of 7.5%.
Question 4: How Sure Can You Be?
On the ad side, the figure you see is what the platform attributes to itself. The honest way to find the next dollar's return is to spend it on purpose, for a set period, and measure what changed.
On the CRO side, each test compares a variant against the current page on split traffic, which is as close to a clean measurement as marketing gets. The catch is the win rate. In the Analytics-Toolkit data, 33.5% of tests produced a statistically significant winner, about one in three, and that's among experienced practitioners. A CRO request that doesn't say how many tests it expects to run for each winner is missing its most important line. Our model above assumes exactly that rate, and the table below shows what happens in a year that does worse.
In a budget meeting, the person who asks "what did the last 10% return?" is usually the one who turns out to be right.
Both Requests in One Table
Each row assumes $5,500 a month for twelve months, a 45% margin and first orders only. The spend stops at month 12, so for the ad rows the 24-month column matches the 12-month one. The CRO rows use the model from question 1, on a $300,000-a-month store.
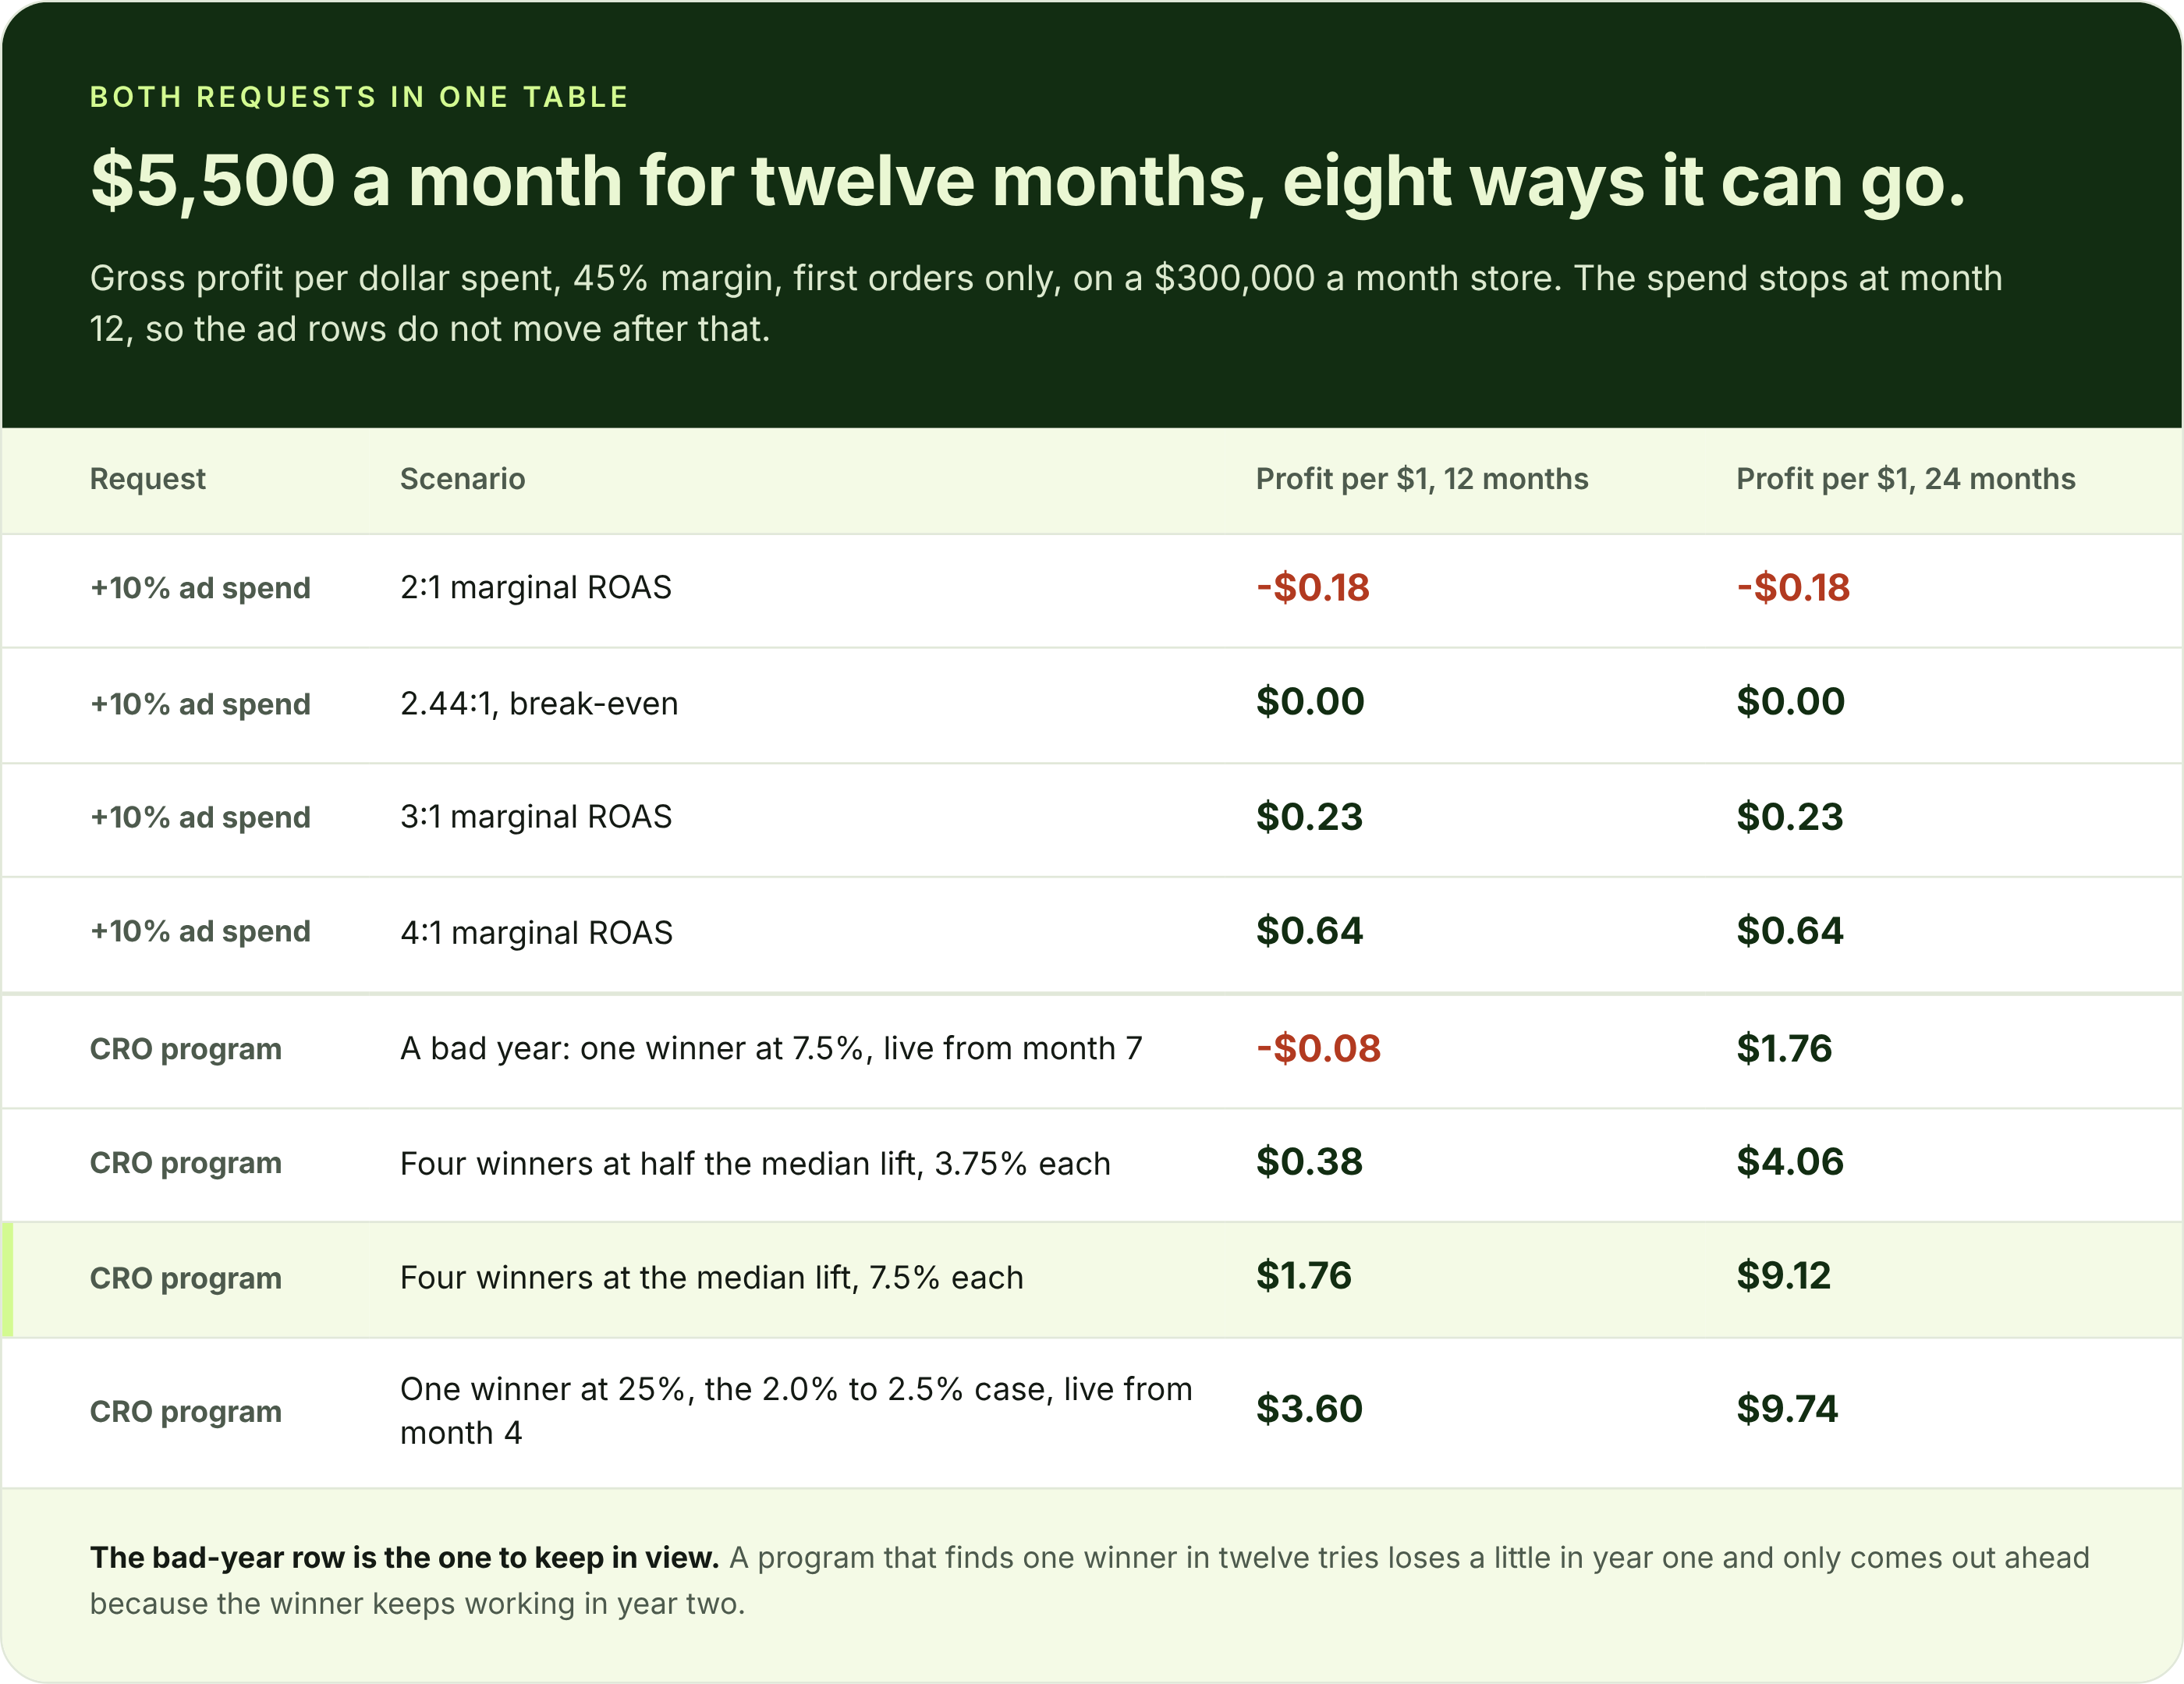
At 2:1, every extra dollar of Meta spend loses you 18 cents. At 4:1, it makes you 64. The whole decision often comes down to which of those your next dollar really is.
When to Turn Down Both Requests
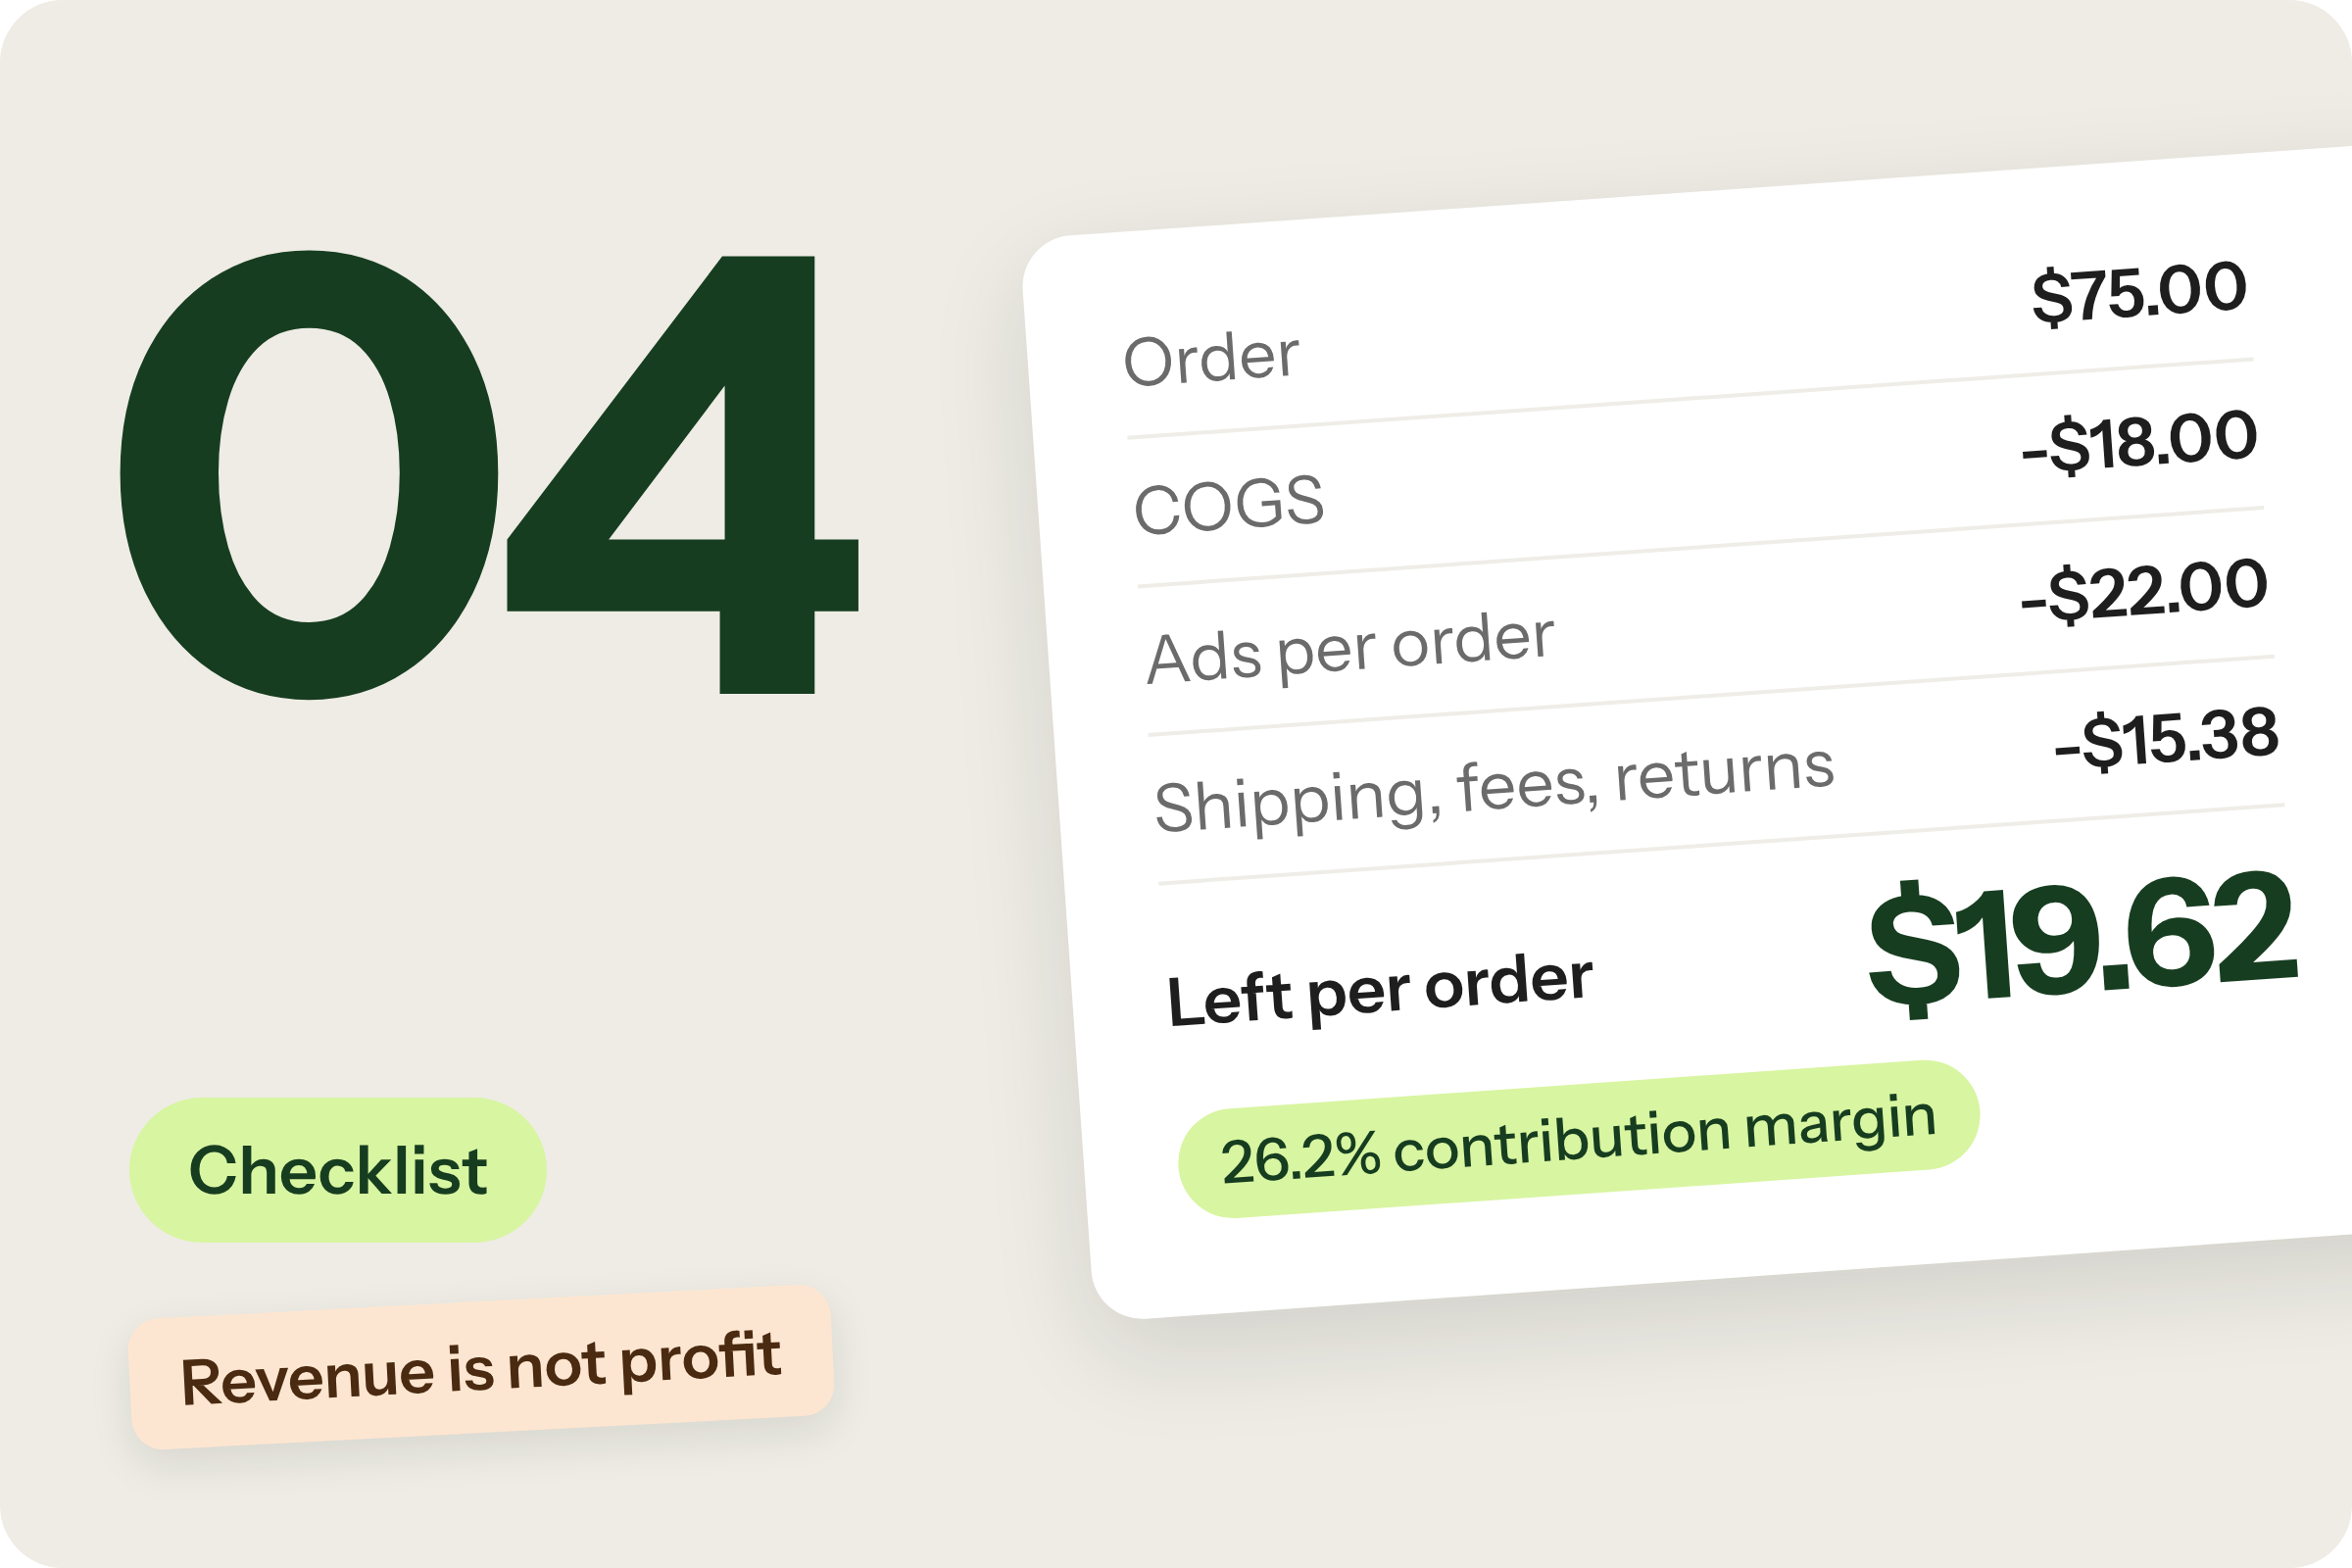
A better conversion rate sells more orders. So does more ad spend. If the order itself is underwater, both requests multiply a loss. Our unit economics checklist covers what to count per order.
Two more cases call for a no on both. If your store is under about 50,000 sessions a month, a four-week test can only confirm lifts of around 18% or more, well above the 7.5% a typical winner delivers, and when to start CRO covers what to do with the budget instead. If your marginal ROAS is also under break-even, the money does more elsewhere. And if you can't fulfill more orders next quarter, neither request has anywhere to go.
Here's the one thing to do before the budget meeting. Find the last month you raised the Meta budget, divide the change in Meta revenue by the change in spend, and compare the result with the break-even table above. If it's under your line, the 10% request has answered itself.
For the CRO column, our CRO ROI calculation guide walks through the formula we use at Weblics, line by line. And since the whole CRO case rests on the win rate, the cheapest way to improve it is to test ideas with better odds from the start. Our product page optimization checklist is the list we start from at Weblics, and it's the same list we'd want to see behind any $5,500 proposal. If you'd rather have both columns run on your own figures, send us your store.
The question isn't whether ads or CRO is better. It's what the next dollar buys.
Sources
• Top Growth Marketing, DTC ecommerce benchmarks, Meta Ads, checked October 2026 (median purchase ROAS 2.96 across 15 brands and $2.46m of managed spend, July 2025 to June 2026)
• Top Growth Marketing, DTC ecommerce benchmarks, Google Ads, checked October 2026 (median purchase ROAS 4.28 across 28 brands and $4.36m of managed spend, September 2025 to August 2026)
• Analytics-Toolkit (Georgi Georgiev), "What Can Be Learned From 1,001 A/B Tests?", 2022 (33.5% significant winners, 7.5% median winning lift)
• Weblics, CRO vs ad spend case study (conversion from 2.0% to 2.5%)
• Model assumptions: $300,000 a month on 150,000 sessions, 45% gross margin, 10% ad fees, $5,500 a month for 12 months, one test a month, one winner in three, lifts added not compounded, first orders only, winners held for 24 months, on the same store as our cost breakdown
Worth a Read


Do you have any questions left?
Here are the answers for you
The return on the next dollar of ad spend rather than the average across everything you've spent. Divide the change in ad-attributed revenue by the change in spend between two comparable periods. Meta's Robyn documentation calls it the "next dollar response", and it's usually lower than the ROAS in your dashboard because each extra dollar of advertising returns less than the one before.
It depends on what the next dollar of ad spend returns. At a 45% gross margin and 10% fees, Meta has to return 2.44:1 on the next dollar just to break even on the first order. If your marginal ROAS is below that, extra ad spend loses money, and CRO usually has the better case, provided you have enough traffic to run tests.
Profit per CRO dollar equals gross margin times the revenue your winning tests add over a period, divided by the program cost, minus one. Count only winners that are live, and use a realistic win rate: in Analytics-Toolkit's analysis of 1,001 tests, 33.5% produced a statistically significant winner.
Any ROAS above your break-even, which is (1 + fees) ÷ gross margin. At a 45% margin and 10% fees, that's 2.44:1. At 35% margin, it's 3.14:1. What matters for a budget increase is the ROAS on the next dollar, which is usually lower than the average in your dashboard.
A winning test lifts the page it runs on. In Analytics-Toolkit's data, the median lift among significant winners was 7.5%, and about one test in three won. On a $300,000-a-month store, a year of one test a month at those rates adds about $405,000 of revenue in the first year and keeps adding about $90,000 a month after that while the winners stay live. A 7.5% lift on the pages your ads land on also raises your effective ROAS on that traffic, from 3:1 to roughly 3.2:1.
Not by default. Compare the return on your last dollars of ad spend with the return a CRO program can realistically deliver over the same horizon. If those last dollars are below break-even, moving them is worth considering.
Every plan includes complete care-driven CRO - what varies is testing capacity and analysis depth.
All Plans Include:
Onboarding (First 5 days):
- Founder interviews & business deep-dive
- Comprehensive technical website audit
- Customer psychology analysis (ICP, 5 WHYs, SWOT)
- AI-trained buyer personas creation
- Ad creatives audit
- Marketing ecosystem review
Ongoing (Continuous):
- Psychology-first hypothesis generation
- Conversion-focused UX/UI design
- Strategic copywriting
- Shopify development & implementation
- A/B testing & QA
- Transparent reporting & documentation
- Strategy meetings (weekly or bi-weekly)
What Changes by Tier:
- Tests per month: 2, 4, 6, or 8 A/B tests
- Meeting frequency: Bi-weekly (Starter) or Weekly (Growth+)
- Analysis depth: Post-purchase surveys, support analysis, inventory strategy, KPI planning, quarterly planning (varies by tier)
Bonus (Growth+): Comprehensive email marketing audit from specialist partners
Flexible plans give you complete control over costs. You pay for the essential CRO work - strategy, hypothesis generation, analysis, A/B test and project management - whilst design, development, and QA are billed separately at $70/hourly only when you need them.
This is perfect if you have an in-house design or development team, or if you want to manage exactly what gets built and when. You're not locked into paying for services you don't need.
Scale plans include everything - strategy, analysis, design, development, QA, and implementation - in one predictable monthly retainer. No surprises, no separate invoices, just complete care-driven CRO delivered autonomously.
Choose Flexible if: You have internal resources or want precise cost control
Choose Scale if: You want fully autonomous, hands-off CRO with everything included
Transparent pricing based on your monthly traffic.
We charge based on traffic volume because testing capacity and statistical significance directly correlate with session count. The more traffic you have, the faster we can run tests and deliver results.
Pricing:
- Starter (50K-75K sessions): $1,650/mo - 2 tests
- Growth (75K-150K sessions): $3,500/mo - 4 tests
- Scale (150K-350K sessions): $6,600/mo - 6 tests
- Enterprise (350K+ sessions): $10,700/mo - 8 tests
No long-term contracts. Cancel anytime.
Every plan includes our 30-day profitability guarantee.
Not sure which plan fits?
Book a discovery call - I'll help you find the perfect match for your business.
Our battle-tested frameworks and systems validate every hypothesis before we build.
Phase 1: Onboarding (First 5 days)
- Deep-dive into your business, customers, and psychology
- Comprehensive technical audit
- 25+ care-driven optimisation hypotheses
- Custom roadmap delivered
Phase 2: Operational (Continuous)
- Validate hypotheses through AI-trained buyer personas
- Ask: "Does this genuinely serve customer needs - not manipulate?"
- Design, develop, and implement winning tests
- Rigorous QA across all devices
- Launch and monitor
Phase 3: Ongoing Analysis (Monthly)
- Behavioural segmentation & data analysis
- Post-purchase survey analysis (Growth+ plans)
- Support ticket insights analysis (Growth+ plans)
- Inventory strategy (Growth+ plans)
- Monthly KPI planning (Growth+ plans)
- Quarterly strategic planning (Scale+ plans)
Yes - but as an addition to our battle-tested frameworks, not the foundation.
We've built a proprietary AI system that validates every hypothesis against your actual buyer personas before we build anything. This ensures we only create optimisations your customers will genuinely respond to.
How it works:
- Our frameworks identify conversion opportunities
- We generate psychology-first hypotheses
- AI-trained buyer personas validate each hypothesis
- We ask: "Does this genuinely serve customer needs—not manipulate?"
- Only validated hypotheses get built and tested
This approach achieves 84% test success rate vs 45% industry average - because we validate with your actual customers before building, not after.
AI enhances our care-driven methodology. It doesn't replace genuine customer understanding.
Simply upgrade to the next tier for more included tests and enhanced ongoing analysis.
We're completely flexible - scale up or down based on your business needs. No penalties, no long-term lock-ins.
Want to discuss expanding your plan? Your dedicated CRO manager can adjust your package anytime.
Yes. No long-term contracts. Cancel anytime.
We earn your business every single month through results - not by trapping you in contracts.
If we don't make you profitable within 30 days, you pay nothing more until we deliver. That's our guarantee.
Most clients stay because care-driven CRO compounds month after month - each winning test keeps generating revenue whilst new tests add even more. But you're never locked in.
We're confident our results will speak for themselves.
Zero micromanagement required. We operate completely autonomously.
We're an extension of your business - making decisions with your profit margins AND mission in mind, not billable hours.
Your involvement:
- Initial onboarding: 2-3 hours (interviews, strategy alignment)
- Weekly/bi-weekly meetings: 30-60 minutes (strategy updates, results review)
- Ad-hoc questions: Slack chat for quick questions
We handle everything else:
- Hypothesis generation
- Design and copywriting
- Development and implementation
- QA across all devices
- A/B test management
- Data analysis and reporting
You focus on running your business. We focus on adding $50K+ monthly to your revenue.
That's the partnership.
We integrate with your existing tools—no forced changes.
Analytics: Shopify Analytics, Microsoft Clarity, GA4
Testing: Intelligems
Management: ClickUp, Figma, Slack
Your data stays in your systems. We integrate seamlessly.
We sign NDAs before any work begins. Your data is protected - always.
Security measures:
- Non-Disclosure Agreement (NDA) signed upfront
- Limited access permissions (only what's necessary)
- Data stored in your systems (we don't migrate your data)
- Team access restricted to assigned personnel only
- Regular security audits
We treat your business like our own - that includes protecting your data like it's our own.
You maintain full control over all access permissions and can revoke them anytime.
Guaranteed profitability in 30 days. $50K+ monthly revenue boost within 60 days.
Tangible outcomes:
But more than numbers - you'll understand your customers deeply, remove friction authentically, and build genuine relationships that compound revenue month after month.
- Increased conversion rates (50-100%+ improvements common)
- Higher average order values
- Improved ROAS (return on ad spend)
- Enhanced customer lifetime value
- Sustainable, compounding revenue growth
Our 84% hypothesis success rate means tests consistently work.
Real client results:
- ForKeeps Merch: $2.3M added revenue (+70% conversion rate)
- Organic Muscle: 128% conversion rate increase
- CKitchen: $1.1M added revenue over 22 months
- Mayven Studios: 50% conversion increase in 2 months
For as long as care-driven CRO continues delivering massive ROI - which typically compounds over 6+ months.
Why long-term partnerships work:
- Each winning test keeps generating revenue permanently
- New tests stack on top of previous wins
- Deeper customer understanding leads to better hypotheses
- Compounding effects multiply over time
Typical timeline:
- Months 1-3: Foundation + initial wins ($50K+ monthly added)
- Months 4-6: Compounding effects visible (wins multiply)
- Months 7-12: Sustainable growth system established
- 12+ months: Category-leading conversion rates achieved
Most clients stay 12-24+ months because results compound. But there's no lock-in - cancel anytime.
We earn your business every month through genuine results, not contracts.
Three simple steps:
Step 1: Book a Discovery Call 30-minute conversation to discuss your traffic, goals, and biggest challenges. We'll explore if we're a good fit and map out your path to $50K+ monthly revenue growth.
Step 2: Get Your Free Audit We'll conduct a comprehensive CRO audit of your website, deliver 25+ psychology-first hypotheses, and show you exactly where your biggest revenue opportunities are.
Step 3: Choose Your Plan & Launch Select the plan that fits your traffic and business needs. We'll onboard you within 5 days and have your first A/B test live within 10 days.
Ready to grow with care-driven CRO?
Or have more questions? Email us: garyk@weblics.agency

Spending more on

Getting less back?
Your ads aren't broken. The store they land on is.
Send us your URL and we'll show you which leaks are eating your ad spend, and which one to fix first.

Just honest findings on your store, within 48h.