


Why Most Shopify Stores Fail at Profitability Before They Even Start Scaling
- What are unit economics and why they decide everything
- How to calculate your Shopify contribution margin
- Your Shopify break-even analysis: the number you must know
- CAC and LTV: the ratio that makes or breaks your DTC business
- How to calculate profit per order on Shopify
- The complete Shopify unit economics checklist
- What to do when your unit economics do not pass the test
What Are Unit Economics and Why They Decide Everything
Think of it like a food truck. Before you park on a busy street and serve 200 people, you want to know whether each sandwich makes you money. If the bread, filling, packaging, and your time cost more than the selling price, serving 200 people just means losing money faster. Scaling a broken unit is not growth - it is accelerated destruction.
The reason this matters for Shopify specifically is that most store owners look at total revenue and feel encouraged. Revenue is a vanity metric. What counts is what lands in your pocket after every cost attached to that transaction is accounted for. The ecommerce profitability metrics that tell the real story are contribution margin, CAC, LTV, and profit per order - and most founders check none of them before launching their first ad campaign.
How to Calculate Your Shopify Contribution Margin
The Shopify Contribution Margin Formula
Contribution Margin = Revenue - COGS - Variable Fulfillment Costs - Payment Processing Fees - Variable Marketing Costs - Returns Allocation
Let's walk through each line with a real example. Say you sell a $75 skincare product.
- Revenue: $75.00
- COGS (product cost): -$18.00
- Shipping and fulfillment: -$7.50
- Shopify payment processing (2.9% + 30c): -$2.48
- Packaging and inserts: -$1.20
- Returns allocation (15% return rate x $28 avg. processing cost): -$4.20
- Variable ad spend per order (your blended CPA): -$22.00
Contribution Margin: $19.62 (26.2%)
That is a healthy margin - but notice how quickly $75 became $19. Now imagine you have a 30% return rate, or your CPA is $40. The math collapses fast.

A healthy ecommerce contribution margin sits between 20-40% for most Shopify stores. If yours is below 15%, you have a structural problem that more ad spend will not fix.
Your Shopify Break-Even Analysis: The Number You Must Know
Picture your Shopify store as a taxi. Your fuel, tyres, and wear-and-tear are variable costs - they only happen when you drive. But your insurance, parking permit, and phone plan exist whether you carry one passenger or a hundred. Those are your fixed costs. Break-even is the point at which enough passengers have covered all of it.
The Break-Even Formula for Shopify
Using the example above, let's say your fixed costs (Shopify subscription, apps, salary, agency fees, warehousing) total $4,500/month and your contribution margin per order is $19.62.
Break-Even = $4,500 / $19.62 = 229 orders per month
That is your floor. Below 229 orders, you are losing money every single month regardless of what your revenue dashboard says. This is why the Shopify break-even analysis is not optional - it is the minimum viability test for your business model.
Once you know your break-even volume, you can work backwards to determine what ad spend and conversion rate you need to hit it. If your store converts at 2% and your break-even is 229 orders, you need at least 11,450 monthly visitors before profit begins.
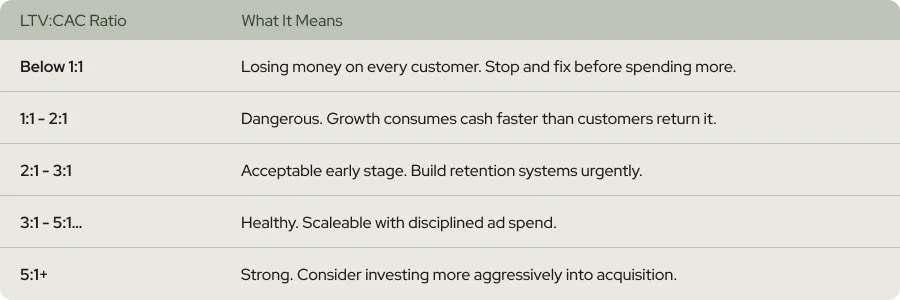
CAC and LTV - The Ratio That Makes or Breaks Your DTC Business
The critical benchmark to know: a healthy LTV:CAC ratio is 3:1 or higher. That means for every dollar you spend acquiring a customer, they return at least three dollars in gross profit over their lifetime. Below 3:1, you are struggling to reinvest in growth. Below 2:1, you are losing money at scale.
How to Calculate Your True CAC
Total monthly marketing spend + agency fees + creative production + platform and attribution tool fees, divided by net new customers acquired in that period.
According to a 2026 Statista DTC report, 68% of DTC brands underestimate their true CAC by 20-40% because they exclude these hidden costs. When you add them all up, Tenten's benchmark data puts full-stack CAC at $60-$120 per customer for most DTC verticals - even in niches where founders think they are acquiring customers for $25.
How to Calculate LTV for Shopify Stores
If your AOV is $75, customers buy 2.5 times per year, and they stay for 18 months on average: LTV = $75 x 2.5 x 1.5 = $281.25
With a CAC of $85, your LTV:CAC ratio is 3.3:1 - just above the minimum viable threshold. Add a repeat purchase email sequence and you might push LTV to $320, which brings your ratio to 3.76:1 and unlocks meaningful reinvestment capacity.
How to Calculate Profit Per Order on Shopify
The formula: Profit Per Order = Contribution Margin - Allocated Fixed Costs Per Order
Allocated fixed costs per order = your monthly fixed costs divided by your total monthly orders.
Using our example: $4,500 fixed costs / 400 monthly orders = $11.25 fixed cost per order.
Profit Per Order = $19.62 - $11.25 = $8.37
At 400 orders/month, you make $8.37 per order - a monthly profit of $3,348. Every additional order above break-even (229 orders) drops almost entirely to profit, because fixed costs are already covered. This is the mechanical beauty of a store with solid unit economics: the marginal profit on order 230 is much higher than on order 1.
The Complete Shopify Unit Economics Checklist
Step 1 - Know your exact COGS per SKU. Include manufacturing, quality control, inbound freight, and import duties if applicable. Many founders use the supplier invoice price and ignore everything else. The gap between invoice price and true landed cost is often 15-30%.
Step 2 - Map every variable cost to an order. Variable costs include: shipping carrier fees, 3PL pick-and-pack charges, packaging materials, inserts, Shopify and payment processing fees (2.9% + $0.30 on Shopify Payments, or 0.5-2% on third-party gateways), and platform transaction fees.
Step 3 - Add a returns allocation line. Calculate your return rate. Multiply it by your average return processing cost. Add that number as a cost per order even on orders that do not get returned - because statistically, a portion of every batch will.
Step 4 - Calculate your true CAC. Add paid ad spend, agency fees, creative costs, and tool fees. Divide by net new customers. Compare this to your contribution margin to confirm each new customer is profitable on the first order, or confirm how many repeat orders you need to break even on acquisition.
Step 5 - Model your LTV honestly. Use real Shopify data. Go to Analytics > Customers > Returning Customers rate. Cross-reference with your average order value and actual purchase frequency. Do not model the best-case customer - model the median.
Step 6 - Calculate break-even volume. Monthly fixed costs / contribution margin per order. This is your monthly floor. Are you consistently above it?
Step 7 - Run a scenario at 2x current volume. What happens to unit economics if you double orders? Does contribution margin hold? Do variable costs per order increase (e.g., 3PL moving to a higher rate tier)? Does CAC increase as you exhaust your warmest audiences? Volume stress-test your numbers before you commit ad budget.
Step 8 - Set a minimum viable profit per order target. Based on your fixed cost structure and desired net margin, what does profit per order need to be? Use this as a guardrail for pricing decisions and ad budget.

What to Do When Your Unit Economics Do Not Pass the Test
Lever 1 - Increase your average order value. Bundles, upsells, and cross-sells raise the revenue per transaction without changing your fixed cost structure. A $10 increase in AOV on a 500-order/month store at 30% contribution margin adds $1,500/month to contribution profit with near-zero additional variable cost.
Lever 2 - Reduce your COGS. Renegotiate with suppliers. Consolidate SKUs to increase order volume and leverage. Source competing quotes. Even a 5% reduction in COGS on a $2M/year store is $100,000 back in contribution margin.
Lever 3 - Cut variable cost per order. Review your fulfillment setup. Are you on the right 3PL rate tier? Are you using the best carrier rates available? Are your packaging costs optimized? Are you on Shopify Payments - or paying extra transaction fees on top of processing? Small per-order savings multiply by volume.
Lever 4 - Improve repeat purchase rate. This is the highest-leverage fix for broken LTV:CAC ratios. Email marketing at near-zero marginal cost converts existing customers at 6-10x the return on ad spend of acquisition campaigns, according to multiple industry benchmarks. A single post-purchase flow, a replenishment reminder, and a 90-day win-back sequence can lift LTV by 30-40% with no increase in CAC.
One important caveat: do not try to fix all four levers at once. You will change too many variables simultaneously and lose the ability to measure what is working. Pick the lever with the biggest gap, fix it, measure the result, then move to the next. Treat your store like the data-driven business it is - not a series of gut feelings.
The stores that scale profitably in 2026 are not the ones with the biggest ad budgets. They are the ones who checked the math first.


Do you have any questions left?
Here are the answers for you
Contribution margin is the single most important metric because it tells you whether selling one more unit makes you money or loses you money. If your contribution margin is negative, no amount of volume will save you - you are literally paying to sell. Get contribution margin positive and healthy before every other optimization.
A healthy ecommerce net profit margin in 2026 runs between 18-26% according to TrueProfit's analysis of 5,000+ stores. The average sits at 10-15%. If your store is below 10%, you have a structural unit economics issue - not a marketing problem. Anything above 25% puts you in the top quartile.
Your CAC is too high when your LTV:CAC ratio drops below 3:1. If a customer generates less than three times their acquisition cost in lifetime gross profit, you cannot sustainably reinvest in growth. The fix is not always to lower CAC - sometimes it is to increase LTV through retention, upsells, and repeat purchase sequences.
Ideally, yes - before you launch and definitely before you scale ad spend. Unit economics tell you whether your pricing, COGS, and fulfillment structure can support a profitable business. Launching without this check means you might spend months and thousands of dollars building an audience for a product that cannot make money at any volume.
This usually means your fixed costs are too high relative to your order volume. Your contribution margin may be positive, but you have not yet hit break-even volume. Calculate your break-even order count and compare it honestly to your current volume. You either need to reduce fixed costs or grow faster through a channel that does not increase variable costs proportionally.
More than you might think. A significant portion of profitability problems on Shopify are conversion rate problems in disguise. If your CPA is $80 because your store converts at 1.2% instead of 3%, fixing the conversion rate can cut CAC by 50-60% overnight - without touching your product pricing, COGS, or fulfillment setup. That is exactly the work Weblics does: identify the conversion and retention gaps that are inflating your CAC and suppressing your LTV.
Every plan includes complete care-driven CRO - what varies is testing capacity and analysis depth.
All Plans Include:
Onboarding (First 5 days):
- Founder interviews & business deep-dive
- Comprehensive technical website audit
- Customer psychology analysis (ICP, 5 WHYs, SWOT)
- AI-trained buyer personas creation
- Ad creatives audit
- Marketing ecosystem review
Ongoing (Continuous):
- Psychology-first hypothesis generation
- Conversion-focused UX/UI design
- Strategic copywriting
- Shopify development & implementation
- A/B testing & QA
- Transparent reporting & documentation
- Strategy meetings (weekly or bi-weekly)
What Changes by Tier:
- Tests per month: 2, 4, 6, or 8 A/B tests
- Meeting frequency: Bi-weekly (Starter) or Weekly (Growth+)
- Analysis depth: Post-purchase surveys, support analysis, inventory strategy, KPI planning, quarterly planning (varies by tier)
Bonus (Growth+): Comprehensive email marketing audit from specialist partners
Flexible plans give you complete control over costs. You pay for the essential CRO work - strategy, hypothesis generation, analysis, A/B test and project management - whilst design, development, and QA are billed separately at $70/hourly only when you need them.
This is perfect if you have an in-house design or development team, or if you want to manage exactly what gets built and when. You're not locked into paying for services you don't need.
Scale plans include everything - strategy, analysis, design, development, QA, and implementation - in one predictable monthly retainer. No surprises, no separate invoices, just complete care-driven CRO delivered autonomously.
Choose Flexible if: You have internal resources or want precise cost control
Choose Scale if: You want fully autonomous, hands-off CRO with everything included
Transparent pricing based on your monthly traffic.
We charge based on traffic volume because testing capacity and statistical significance directly correlate with session count. The more traffic you have, the faster we can run tests and deliver results.
Pricing:
- Starter (50K-75K sessions): $1,650/mo - 2 tests
- Growth (75K-150K sessions): $3,500/mo - 4 tests
- Scale (150K-350K sessions): $6,600/mo - 6 tests
- Enterprise (350K+ sessions): $10,700/mo - 8 tests
No long-term contracts. Cancel anytime.
Every plan includes our 30-day profitability guarantee.
Not sure which plan fits?
Book a discovery call - I'll help you find the perfect match for your business.
Our battle-tested frameworks and systems validate every hypothesis before we build.
Phase 1: Onboarding (First 5 days)
- Deep-dive into your business, customers, and psychology
- Comprehensive technical audit
- 25+ care-driven optimisation hypotheses
- Custom roadmap delivered
Phase 2: Operational (Continuous)
- Validate hypotheses through AI-trained buyer personas
- Ask: "Does this genuinely serve customer needs - not manipulate?"
- Design, develop, and implement winning tests
- Rigorous QA across all devices
- Launch and monitor
Phase 3: Ongoing Analysis (Monthly)
- Behavioural segmentation & data analysis
- Post-purchase survey analysis (Growth+ plans)
- Support ticket insights analysis (Growth+ plans)
- Inventory strategy (Growth+ plans)
- Monthly KPI planning (Growth+ plans)
- Quarterly strategic planning (Scale+ plans)
Yes - but as an addition to our battle-tested frameworks, not the foundation.
We've built a proprietary AI system that validates every hypothesis against your actual buyer personas before we build anything. This ensures we only create optimisations your customers will genuinely respond to.
How it works:
- Our frameworks identify conversion opportunities
- We generate psychology-first hypotheses
- AI-trained buyer personas validate each hypothesis
- We ask: "Does this genuinely serve customer needs—not manipulate?"
- Only validated hypotheses get built and tested
This approach achieves 84% test success rate vs 45% industry average - because we validate with your actual customers before building, not after.
AI enhances our care-driven methodology. It doesn't replace genuine customer understanding.
Simply upgrade to the next tier for more included tests and enhanced ongoing analysis.
We're completely flexible - scale up or down based on your business needs. No penalties, no long-term lock-ins.
Want to discuss expanding your plan? Your dedicated CRO manager can adjust your package anytime.
Yes. No long-term contracts. Cancel anytime.
We earn your business every single month through results - not by trapping you in contracts.
If we don't make you profitable within 30 days, you pay nothing more until we deliver. That's our guarantee.
Most clients stay because care-driven CRO compounds month after month - each winning test keeps generating revenue whilst new tests add even more. But you're never locked in.
We're confident our results will speak for themselves.
Zero micromanagement required. We operate completely autonomously.
We're an extension of your business - making decisions with your profit margins AND mission in mind, not billable hours.
Your involvement:
- Initial onboarding: 2-3 hours (interviews, strategy alignment)
- Weekly/bi-weekly meetings: 30-60 minutes (strategy updates, results review)
- Ad-hoc questions: Slack chat for quick questions
We handle everything else:
- Hypothesis generation
- Design and copywriting
- Development and implementation
- QA across all devices
- A/B test management
- Data analysis and reporting
You focus on running your business. We focus on adding $50K+ monthly to your revenue.
That's the partnership.
We integrate with your existing tools—no forced changes.
Analytics: Shopify Analytics, Microsoft Clarity, GA4
Testing: Intelligems
Management: ClickUp, Figma, Slack
Your data stays in your systems. We integrate seamlessly.
We sign NDAs before any work begins. Your data is protected - always.
Security measures:
- Non-Disclosure Agreement (NDA) signed upfront
- Limited access permissions (only what's necessary)
- Data stored in your systems (we don't migrate your data)
- Team access restricted to assigned personnel only
- Regular security audits
We treat your business like our own - that includes protecting your data like it's our own.
You maintain full control over all access permissions and can revoke them anytime.
Guaranteed profitability in 30 days. $50K+ monthly revenue boost within 60 days.
Tangible outcomes:
But more than numbers - you'll understand your customers deeply, remove friction authentically, and build genuine relationships that compound revenue month after month.
- Increased conversion rates (50-100%+ improvements common)
- Higher average order values
- Improved ROAS (return on ad spend)
- Enhanced customer lifetime value
- Sustainable, compounding revenue growth
Our 84% hypothesis success rate means tests consistently work.
Real client results:
- ForKeeps Merch: $2.3M added revenue (+70% conversion rate)
- Organic Muscle: 128% conversion rate increase
- CKitchen: $1.1M added revenue over 22 months
- Mayven Studios: 50% conversion increase in 2 months
For as long as care-driven CRO continues delivering massive ROI - which typically compounds over 6+ months.
Why long-term partnerships work:
- Each winning test keeps generating revenue permanently
- New tests stack on top of previous wins
- Deeper customer understanding leads to better hypotheses
- Compounding effects multiply over time
Typical timeline:
- Months 1-3: Foundation + initial wins ($50K+ monthly added)
- Months 4-6: Compounding effects visible (wins multiply)
- Months 7-12: Sustainable growth system established
- 12+ months: Category-leading conversion rates achieved
Most clients stay 12-24+ months because results compound. But there's no lock-in - cancel anytime.
We earn your business every month through genuine results, not contracts.
Three simple steps:
Step 1: Book a Discovery Call 30-minute conversation to discuss your traffic, goals, and biggest challenges. We'll explore if we're a good fit and map out your path to $50K+ monthly revenue growth.
Step 2: Get Your Free Audit We'll conduct a comprehensive CRO audit of your website, deliver 25+ psychology-first hypotheses, and show you exactly where your biggest revenue opportunities are.
Step 3: Choose Your Plan & Launch Select the plan that fits your traffic and business needs. We'll onboard you within 5 days and have your first A/B test live within 10 days.
Ready to grow with care-driven CRO?
Or have more questions? Email us: garyk@weblics.agency

Wait… Claim your free bonuses
Find out exactly where your store is leaking revenue — and where your ad spend is going to waste. No pitch, just data.

Just honest findings delivered within 2 business days.