


Shopify Conversion Rate Benchmarks by Industry (2026)
• Industry, average order value, traffic source, device and store size each move the number more than most people expect. Email traffic converts at 5-8%, TikTok ads at 1.2-2.2%.
• Average order value is the strongest single predictor: stores under $60 AOV convert at a 2.42% median, stores above $200 at 0.79% (DTC Pages, 21 Shopify stores, Q2 2026).
• Most published tables do not state whether they divide by sessions or by visitors. Shopify Analytics divides by sessions.
• Retail conversion fell 5.5% year over year in Contentsquare's 2026 benchmark, so a table from 2023 makes a healthy store look like it is failing.
• The useful comparison is your own four funnel steps against their typical ranges, not your site-wide rate against a stranger's.
- What is a good Shopify conversion rate?
- Ecommerce conversion rate benchmarks by industry
- Conversion rate benchmarks by average order value
- Why conversion benchmarks contradict each other
- Check what your Shopify dashboard is actually measuring
- Conversion rate benchmarks by traffic source
- Conversion rate benchmarks by device
- Why bigger stores convert lower
- When a low conversion rate is the correct number
- Two stores at 2.1%, and how to tell them apart
- Glossary
- FAQ
What Is a Good Shopify Conversion Rate?
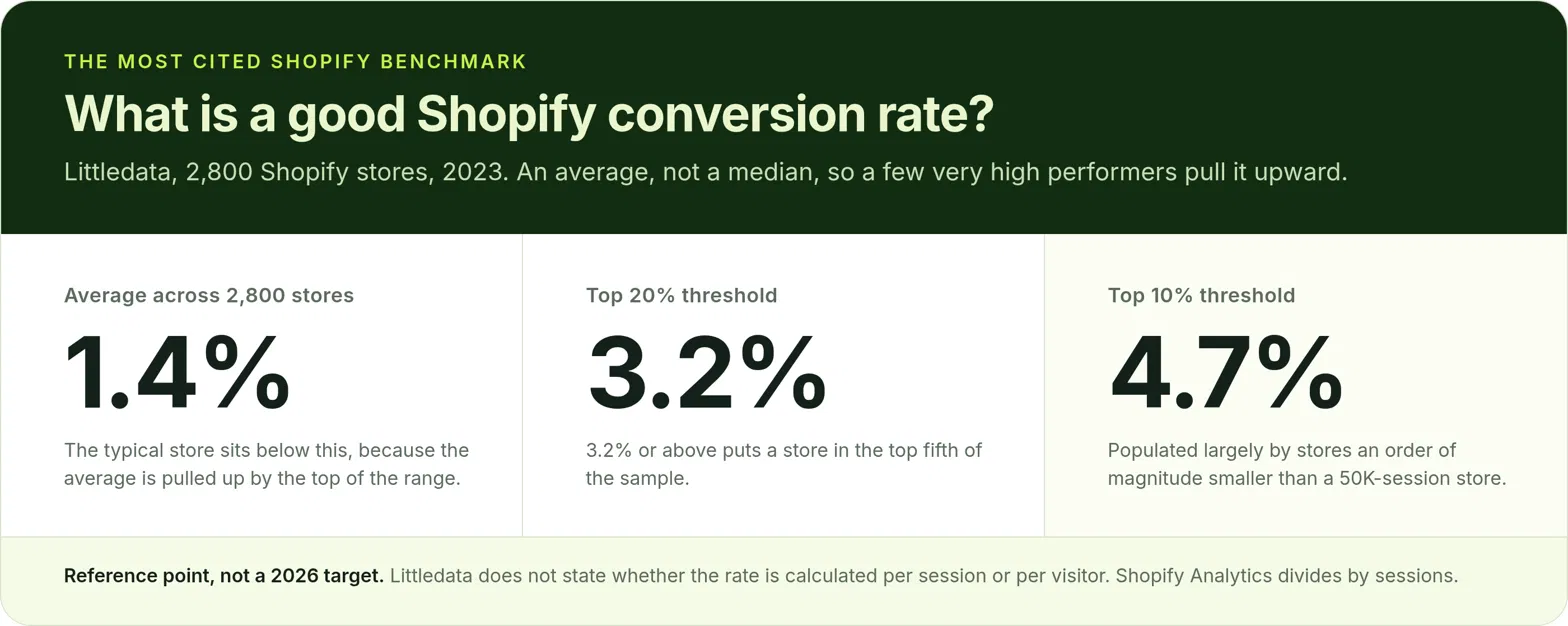
It is an average, not a median, so a handful of very high performers pull it upward while the typical store sits below it. And the study is from 2023. It remains the most cited Shopify-specific figure available, which is why it is here, but treat it as a reference point rather than a 2026 target.
What a good conversion rate is for you depends on five things this page works through in order: your industry, your average order value, your traffic mix, your device split, and your store's size. Each one moves the number more than most people expect.
Ecommerce Conversion Rate Benchmarks by Industry
Conversion Rate Benchmarks by Average Order Value
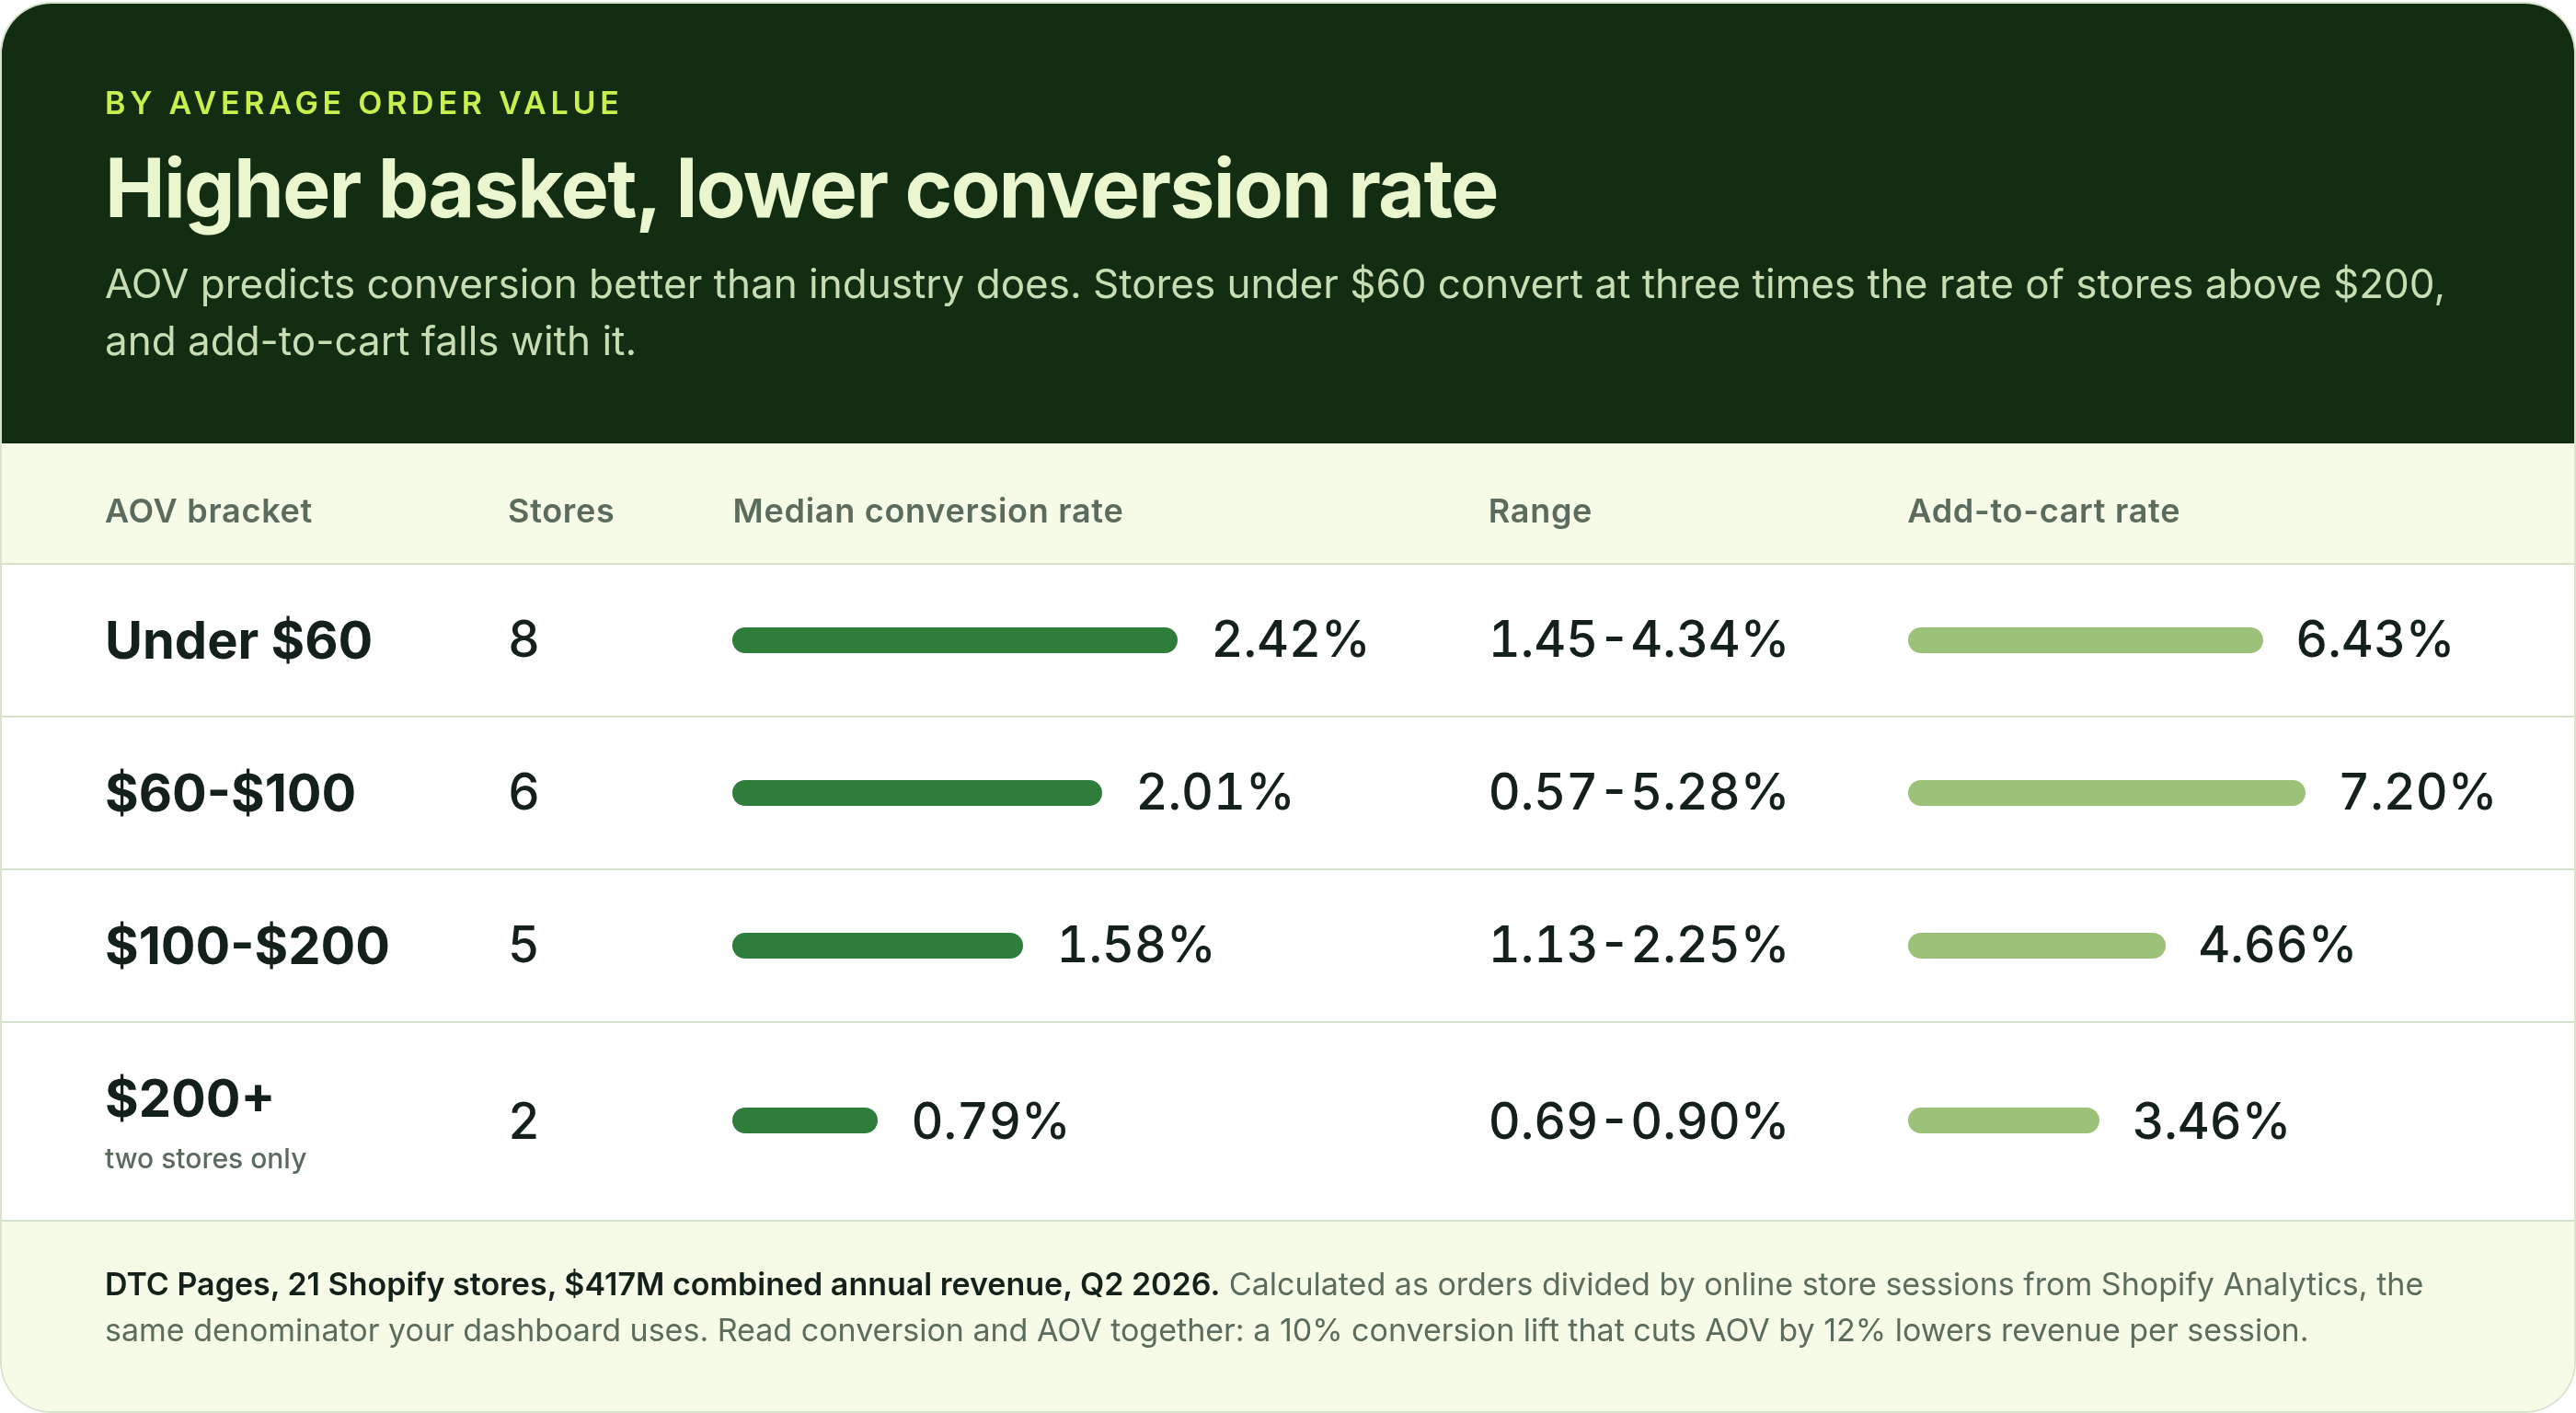
Two things follow for how you read your own number. A store at 0.9% with a $230 basket is performing normally, and a redesign chasing 2% will spend a quarter fighting the price point. And a conversion win bought with a smaller basket is not a win: if a test lifts conversion by 10% and cuts AOV by 12%, revenue per session went down. Read the two together, which is why every table on this page should be paired with the AOV your store actually carries.
Why Conversion Rate Benchmarks Contradict Each Other
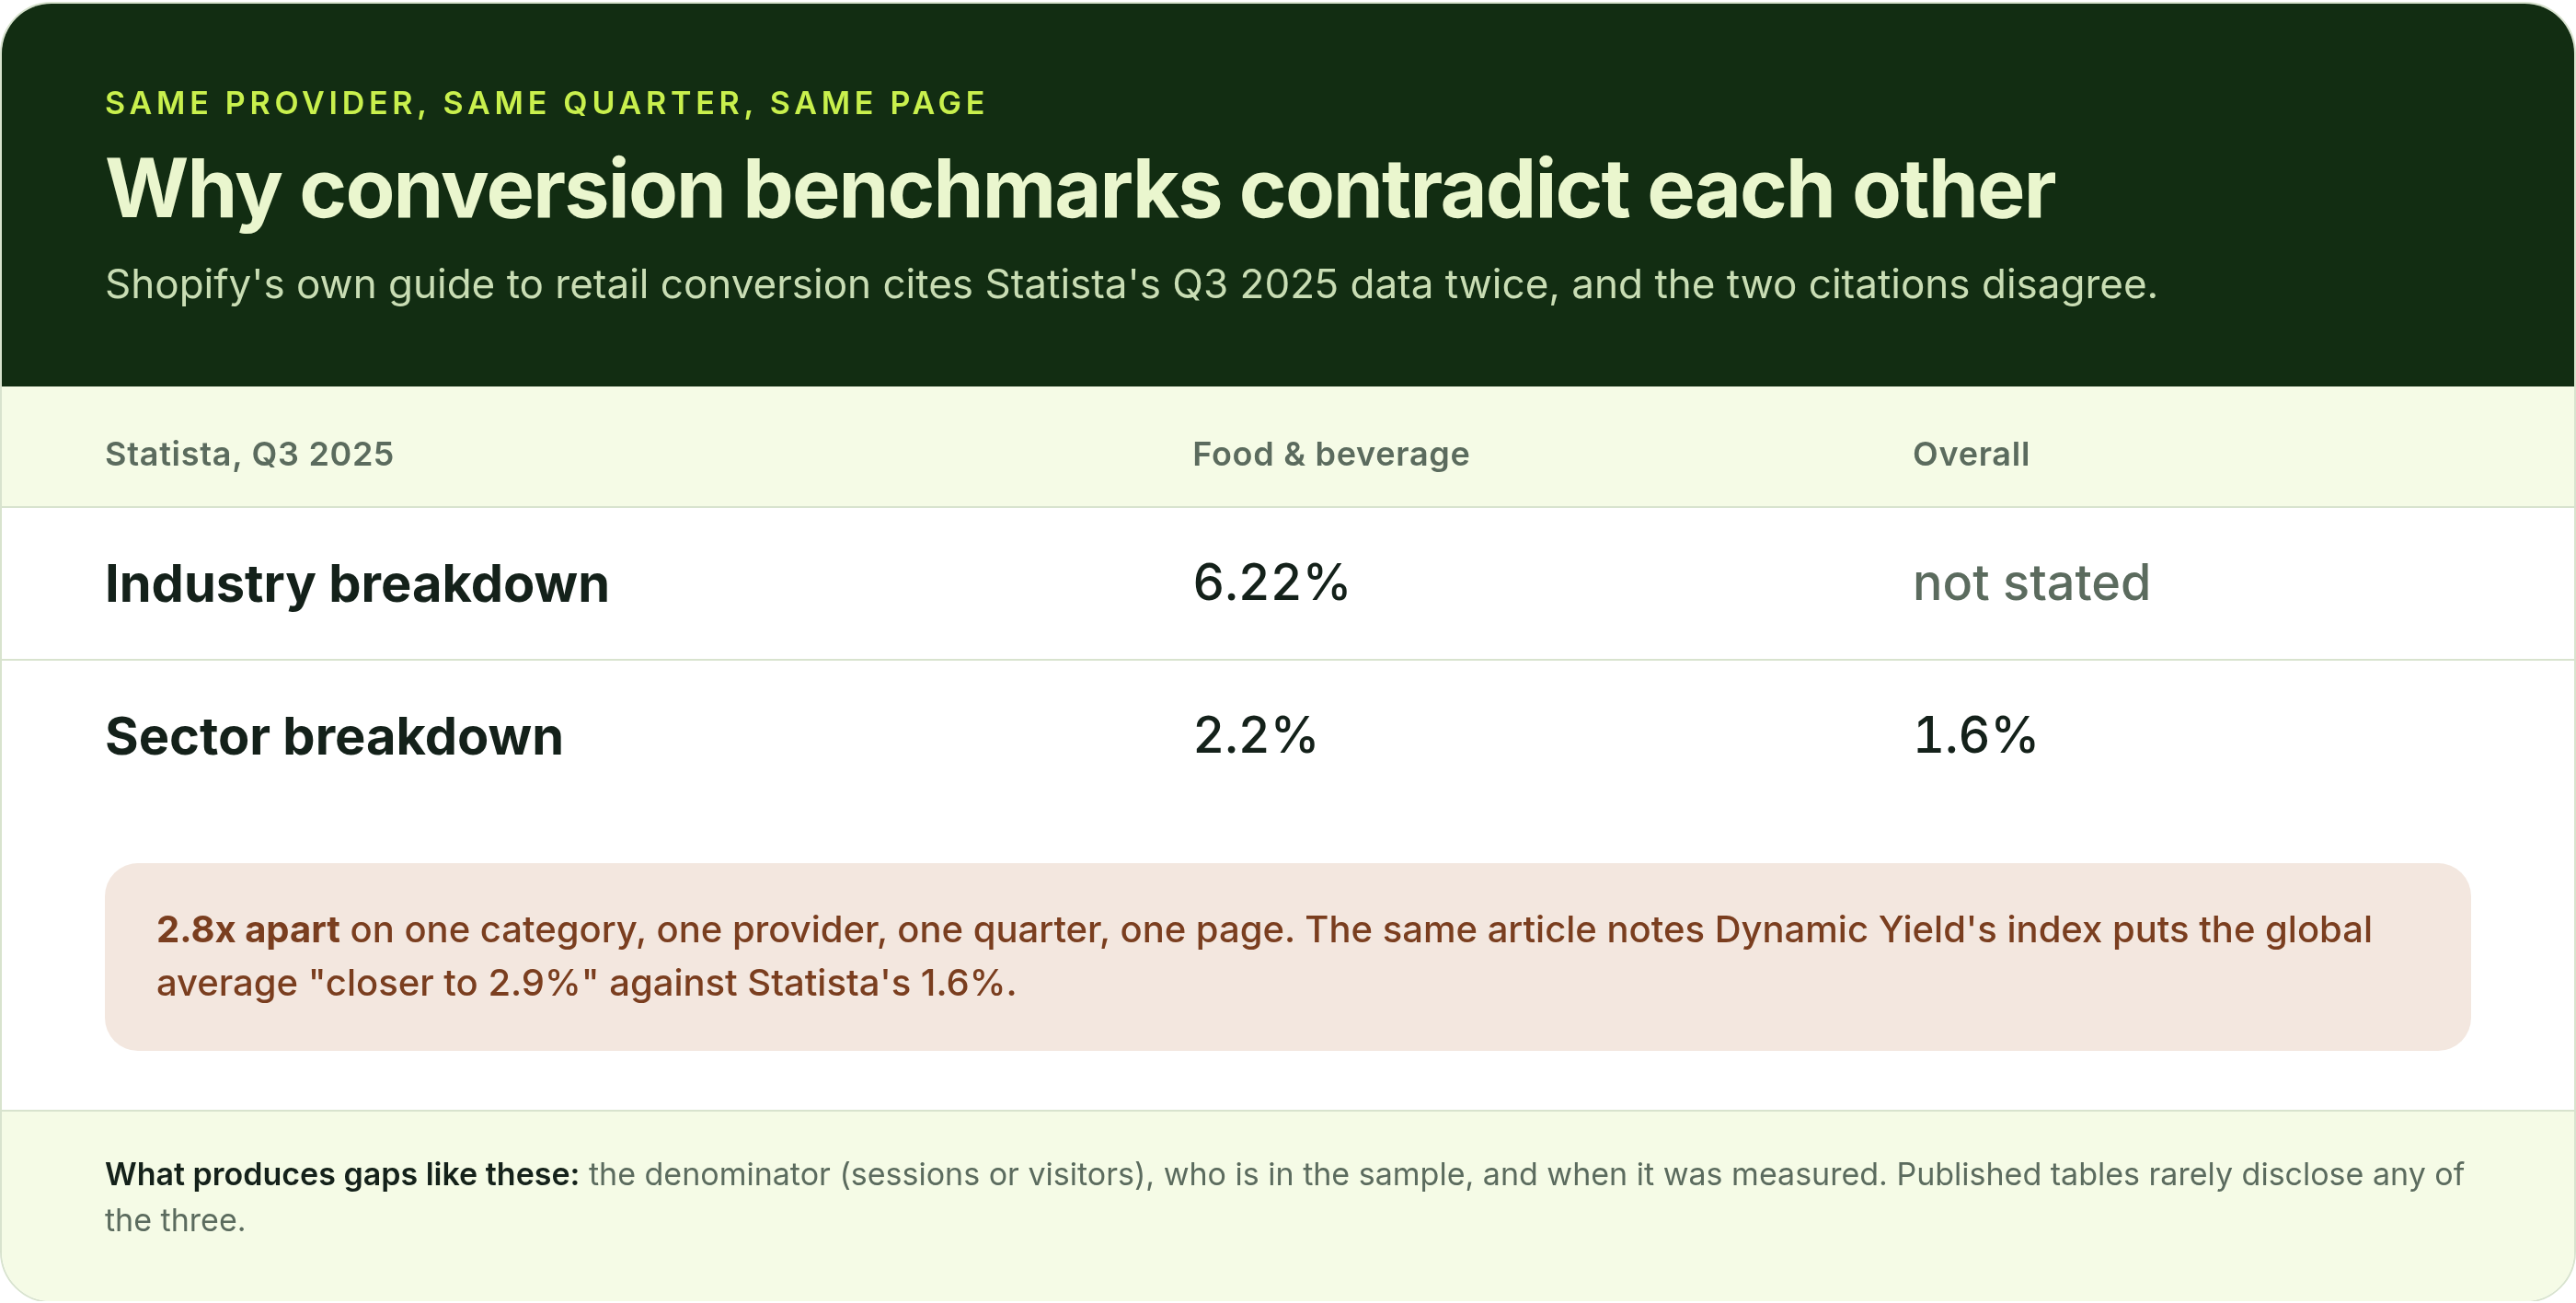
Three things produce gaps like these, and published tables rarely disclose any of them.
The denominator. A visitor who returns three times before buying is one visitor and three sessions. Orders divided by sessions therefore reports a materially lower rate than orders divided by visitors on the identical store. Most benchmark tables, including both cited above, never say which one they used.
Who is in the sample. A global merchant base, a panel of UK small retailers, and a set of enterprise brands running a personalization platform are three different populations. Each is real. None is interchangeable with the others.
When it was measured. Retail conversion is seasonal and currently moving. Contentsquare's 2026 retail benchmark reports overall conversion down 5.5% year over year, and that decline is not evenly spread: desktop fell 8% while mobile fell 3.5%.
It is like comparing your mile time to somebody else's kilometer time. Both are real numbers. Neither tells you who is faster.
Check What Your Shopify Dashboard Is Actually Measuring
1. Open Shopify Analytics, Reports, Conversion rate, or the conversion figure on your Overview dashboard.
2. Set the range to the last 90 days. Anything shorter is noise for most stores.
3. Note the number, and note that Shopify calculates it as orders divided by sessions.
4. Write it down. You will narrow it three more times before the end of this page.
Step three is the one that catches people. Your dashboard has a defined denominator. Most published tables do not disclose theirs. A store comparing its sessions-based dashboard figure against a table that quietly counted visitors is understating its own performance, and has no way to tell by how much.
That does not make benchmarks useless. It means you should treat a single published percentage as a range, and put your weight on comparisons where the denominator is fixed: your store against itself over time, and your channels against each other.
Shopify Conversion Rate Benchmarks by Traffic Source
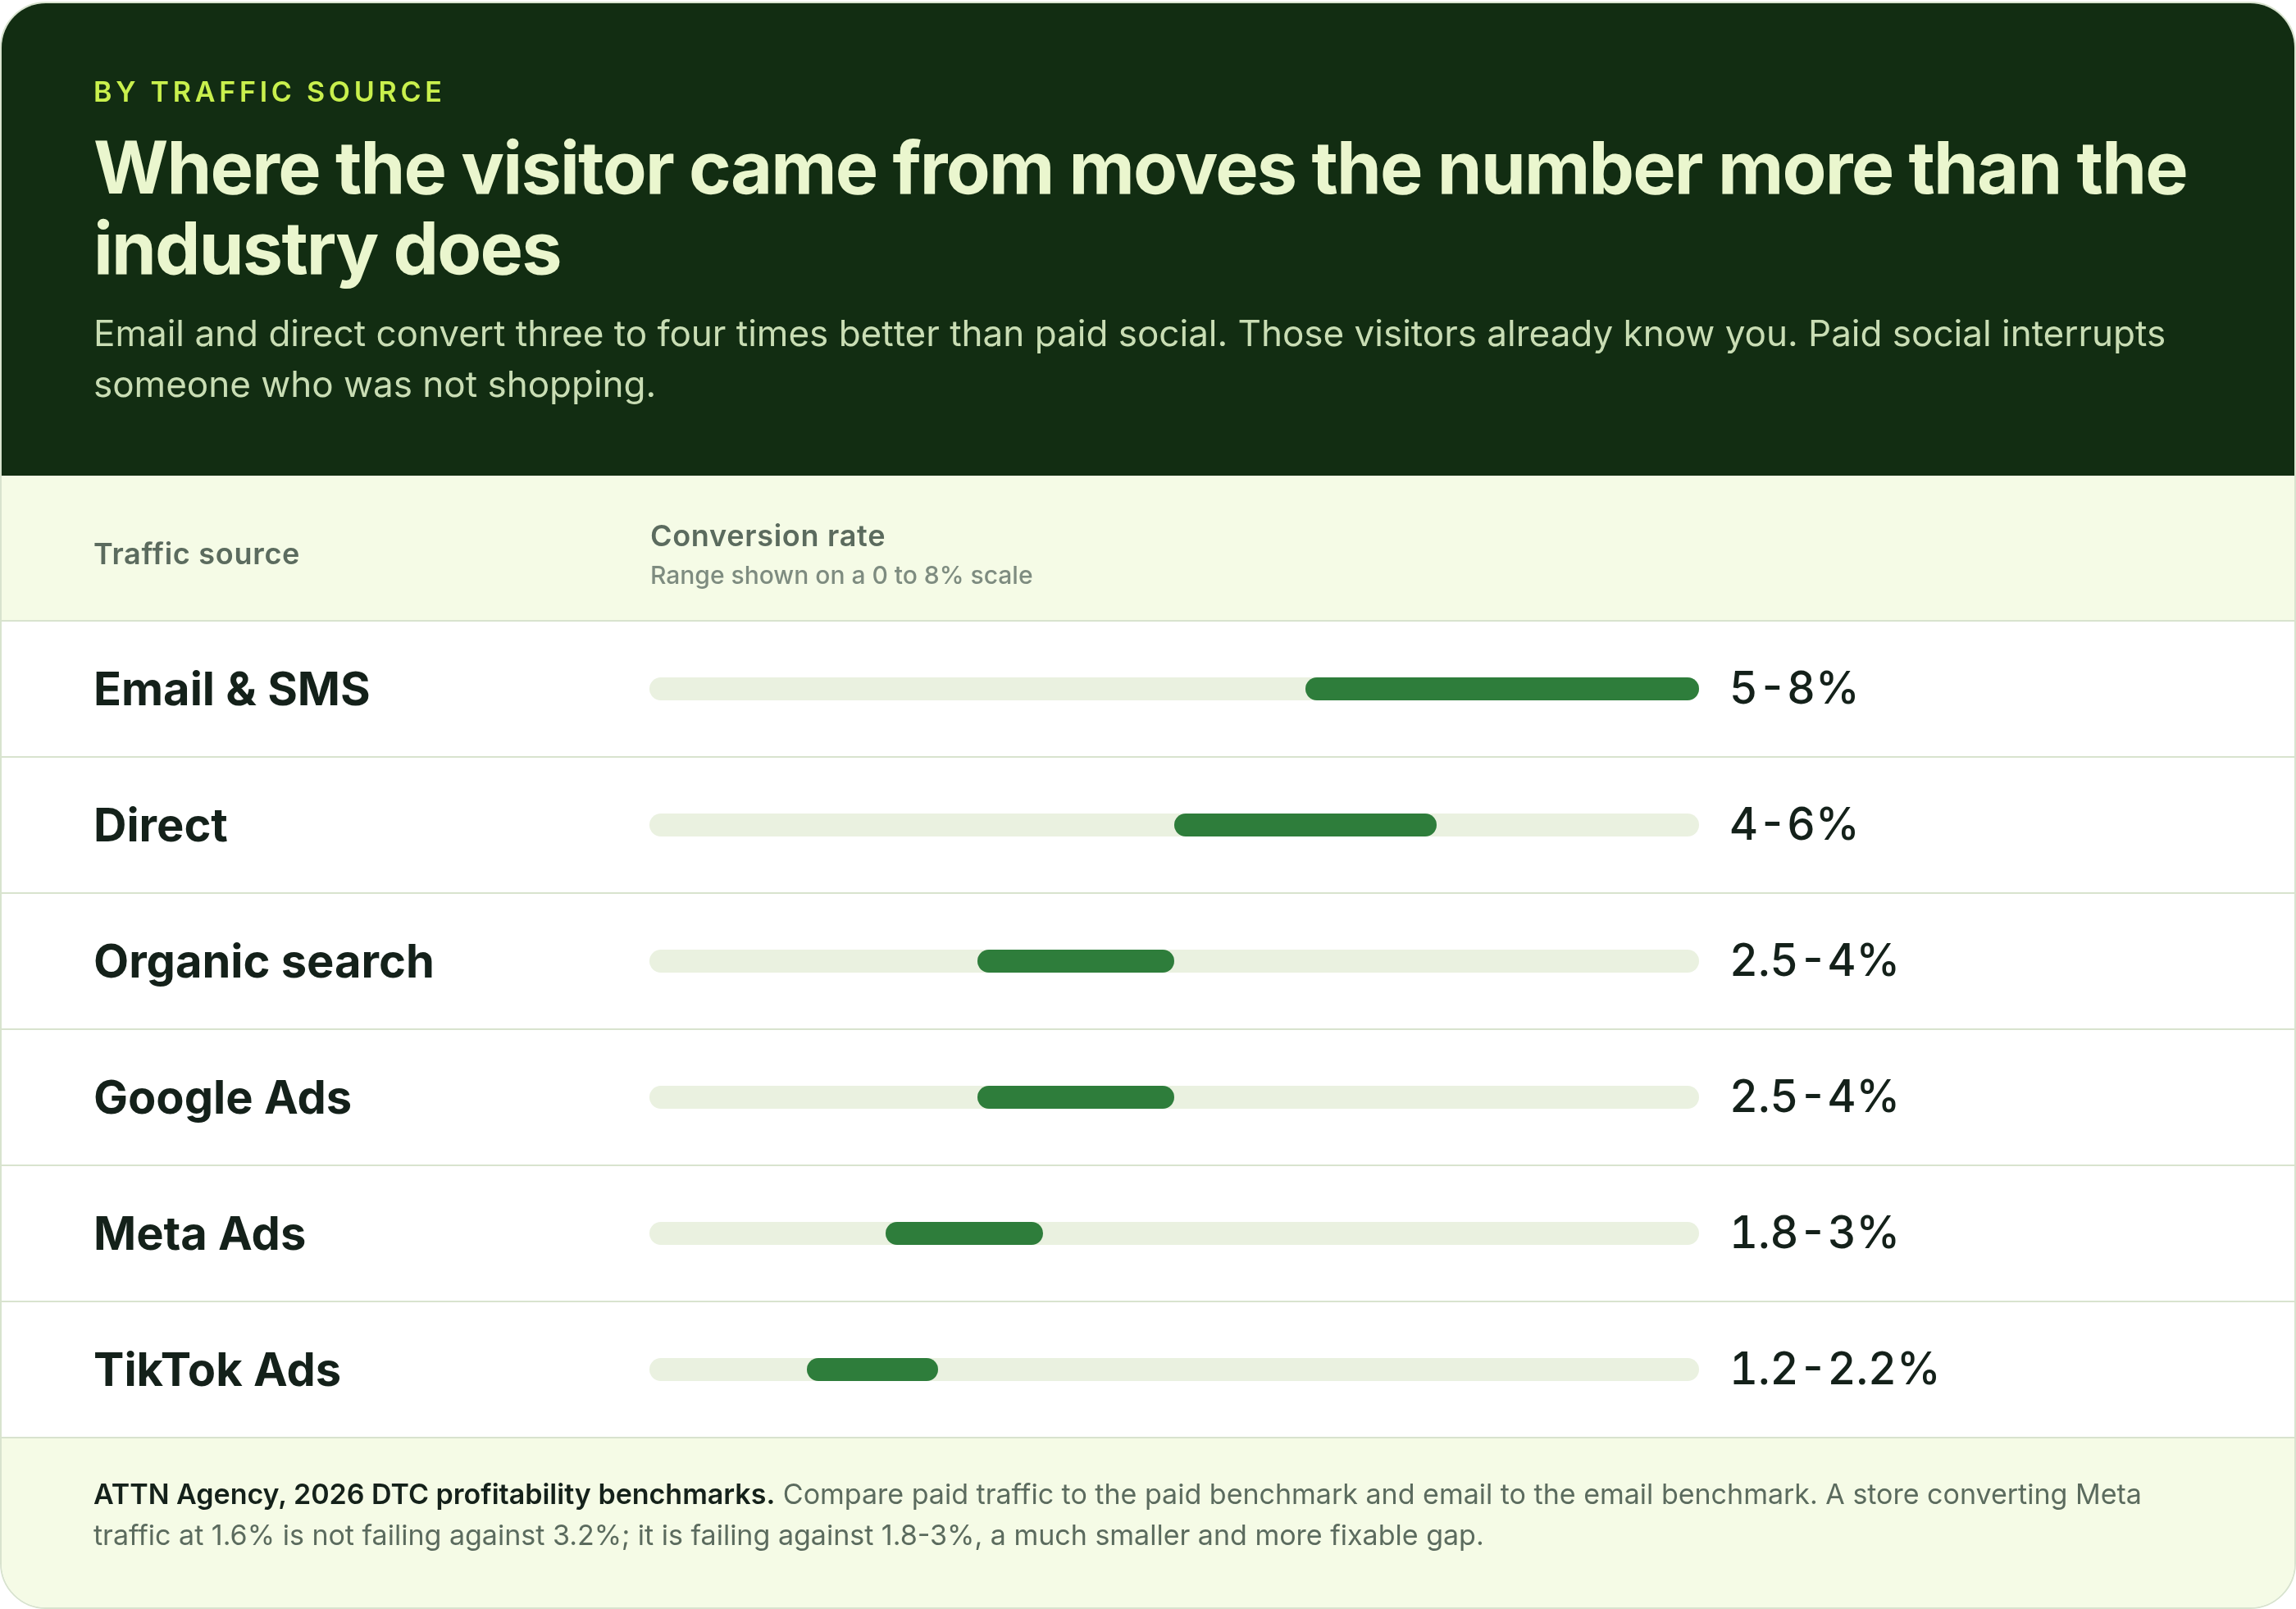
This is why a blended site-wide conversion rate is a weak diagnostic. A store shifting from 30% paid to 70% paid will watch its overall conversion rate fall while every individual channel holds steady or improves. Nothing got worse. The mix changed.
Compare paid traffic to the paid benchmark and email to the email benchmark. A store converting Meta traffic at 1.6% is not failing against 3.2%. It is failing against 1.8-3%, which is a much smaller and much more fixable gap. What that gap costs at scale is the subject of our piece on CRO vs ad spend.
Shopify Conversion Rate Benchmarks by Device
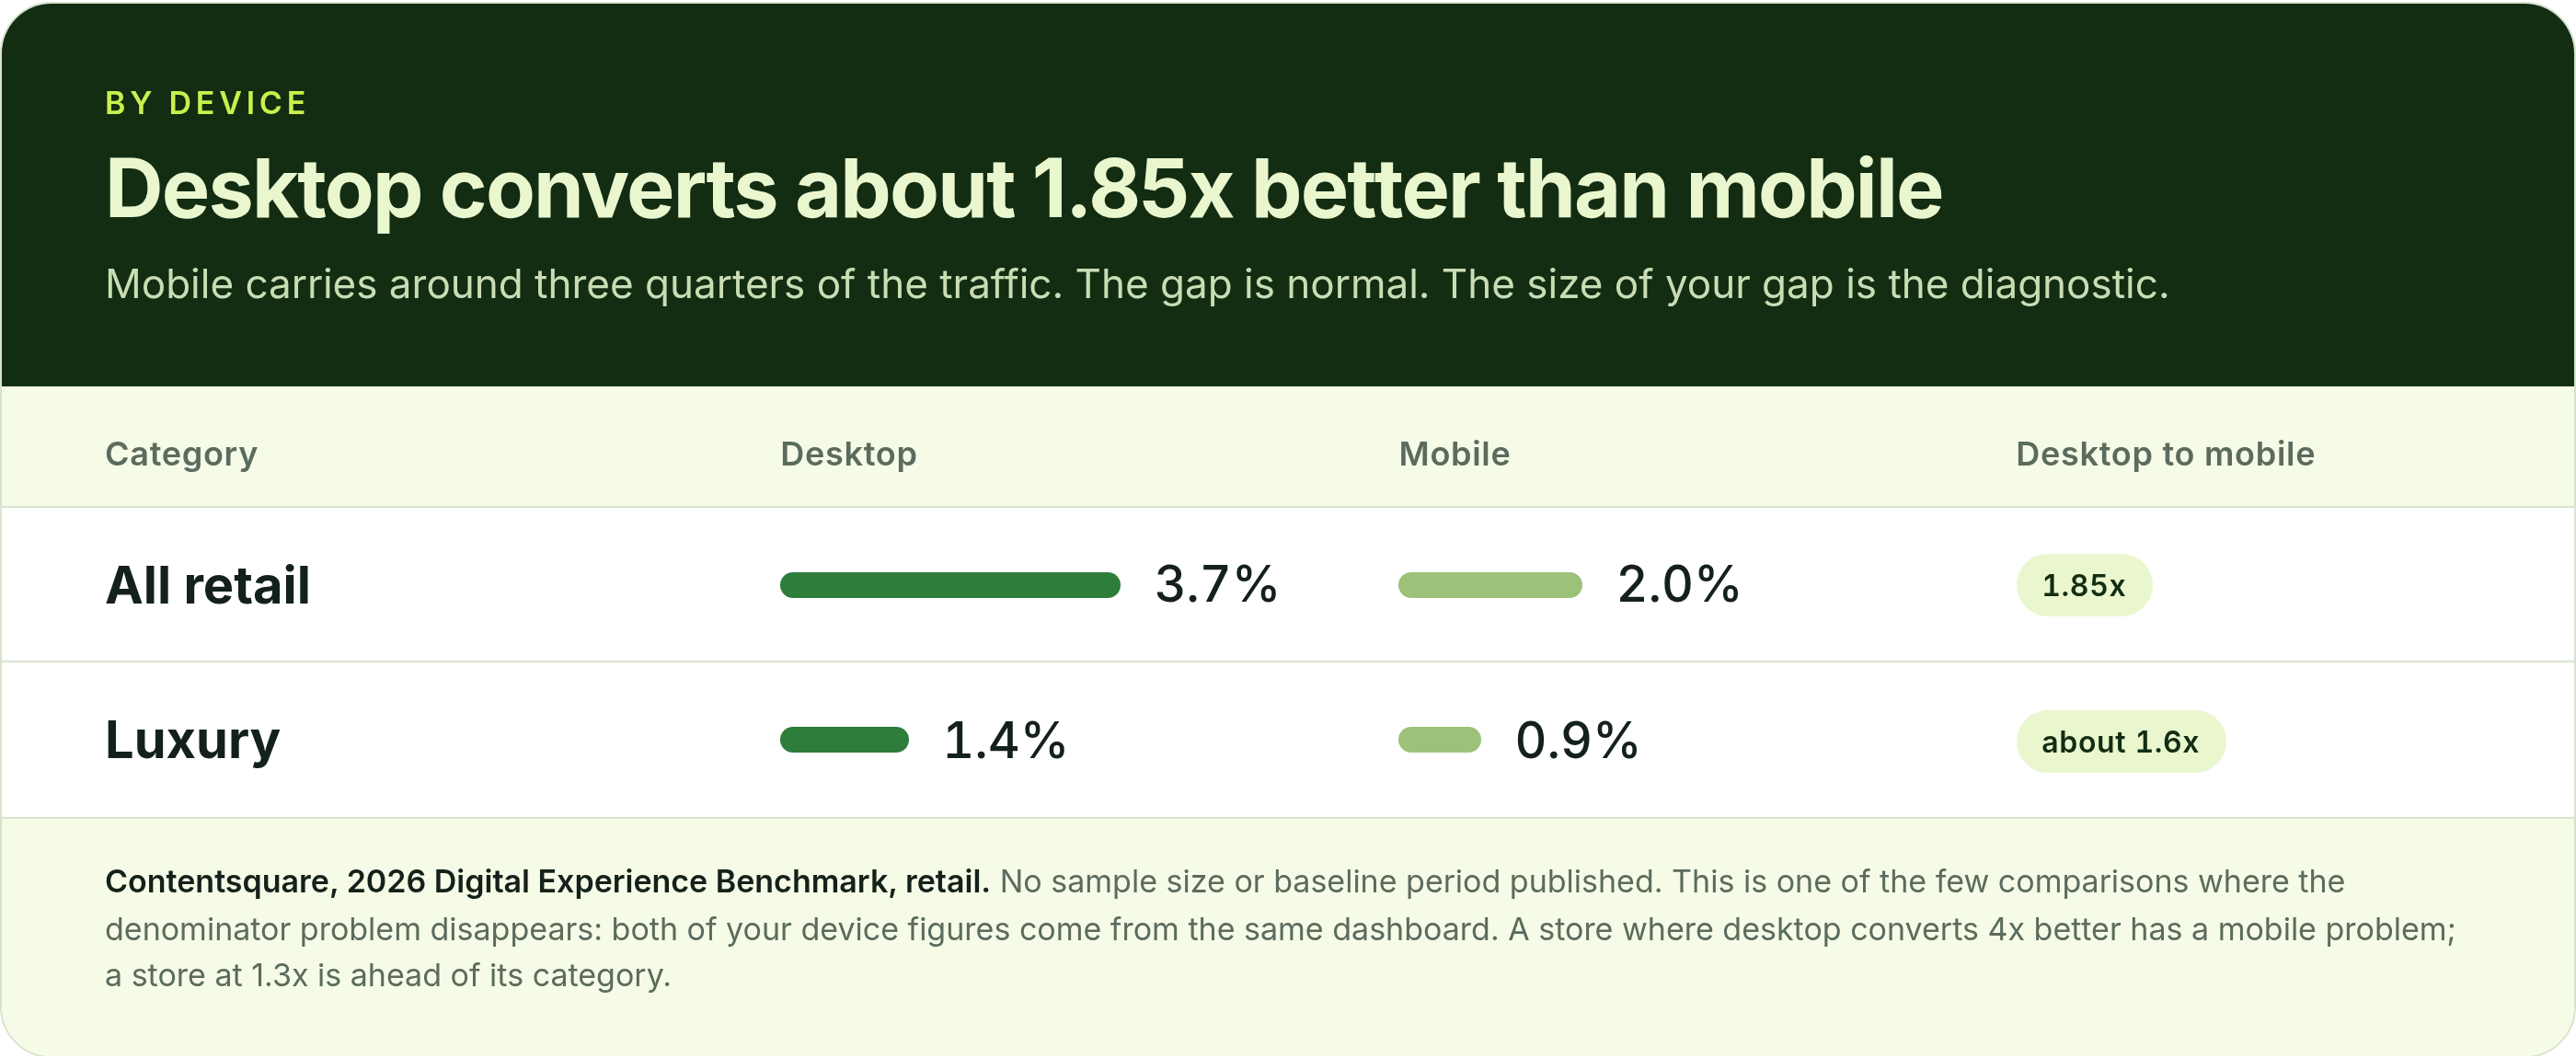
The gap itself is normal. The size of your gap is the diagnostic, and it is one of the few comparisons on this page where the denominator problem disappears, because both of your device figures come from the same dashboard measured the same way.
Retail averages a 1.85x desktop-to-mobile ratio. A store where desktop converts 4x better has a mobile problem worth more than most of the tests on its roadmap. A store at 1.3x is already ahead of its category.
Split your own number by device now. The ratio matters more than either figure.
Why Bigger Shopify Stores Convert Lower
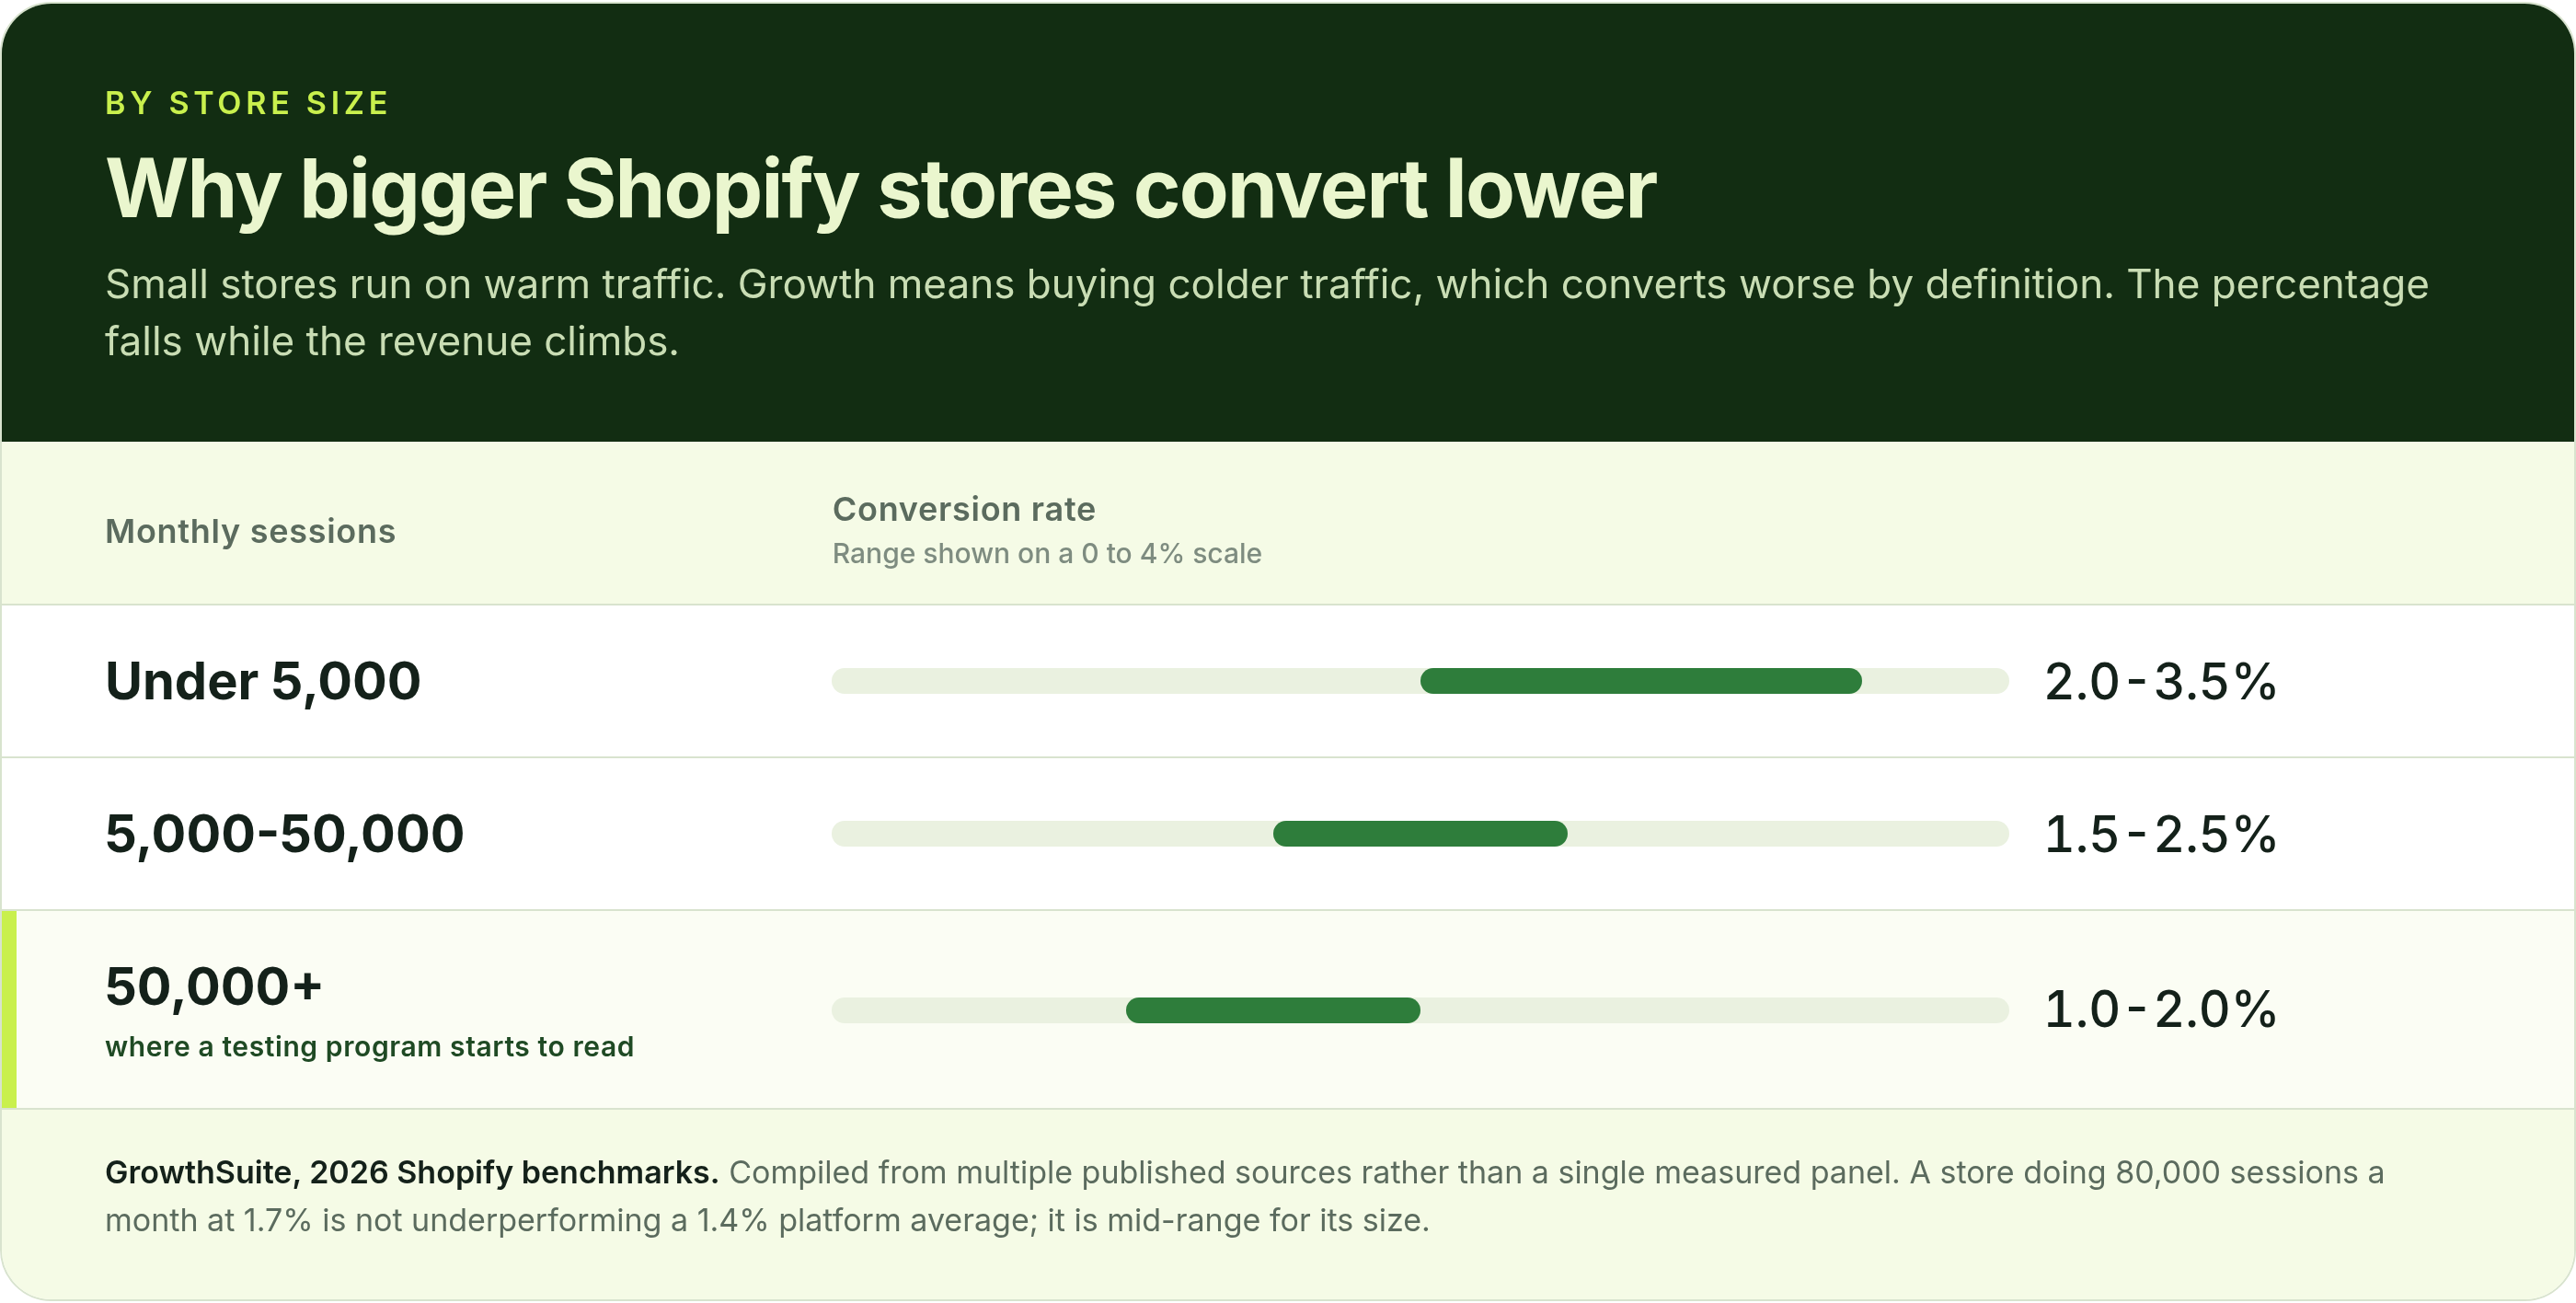
Think of a shop on a busy high street versus one down a side alley. The alley shop converts a higher share of the people who walk in, because only people looking for it walk in. The high street shop converts a lower share and takes far more money.
So a store doing 80,000 sessions a month at 1.7% is not underperforming a 1.4% platform average. It is sitting mid-range for its size, and the 4.7% top-decile threshold is populated largely by stores an order of magnitude smaller.
When a Low Conversion Rate Is the Correct Number
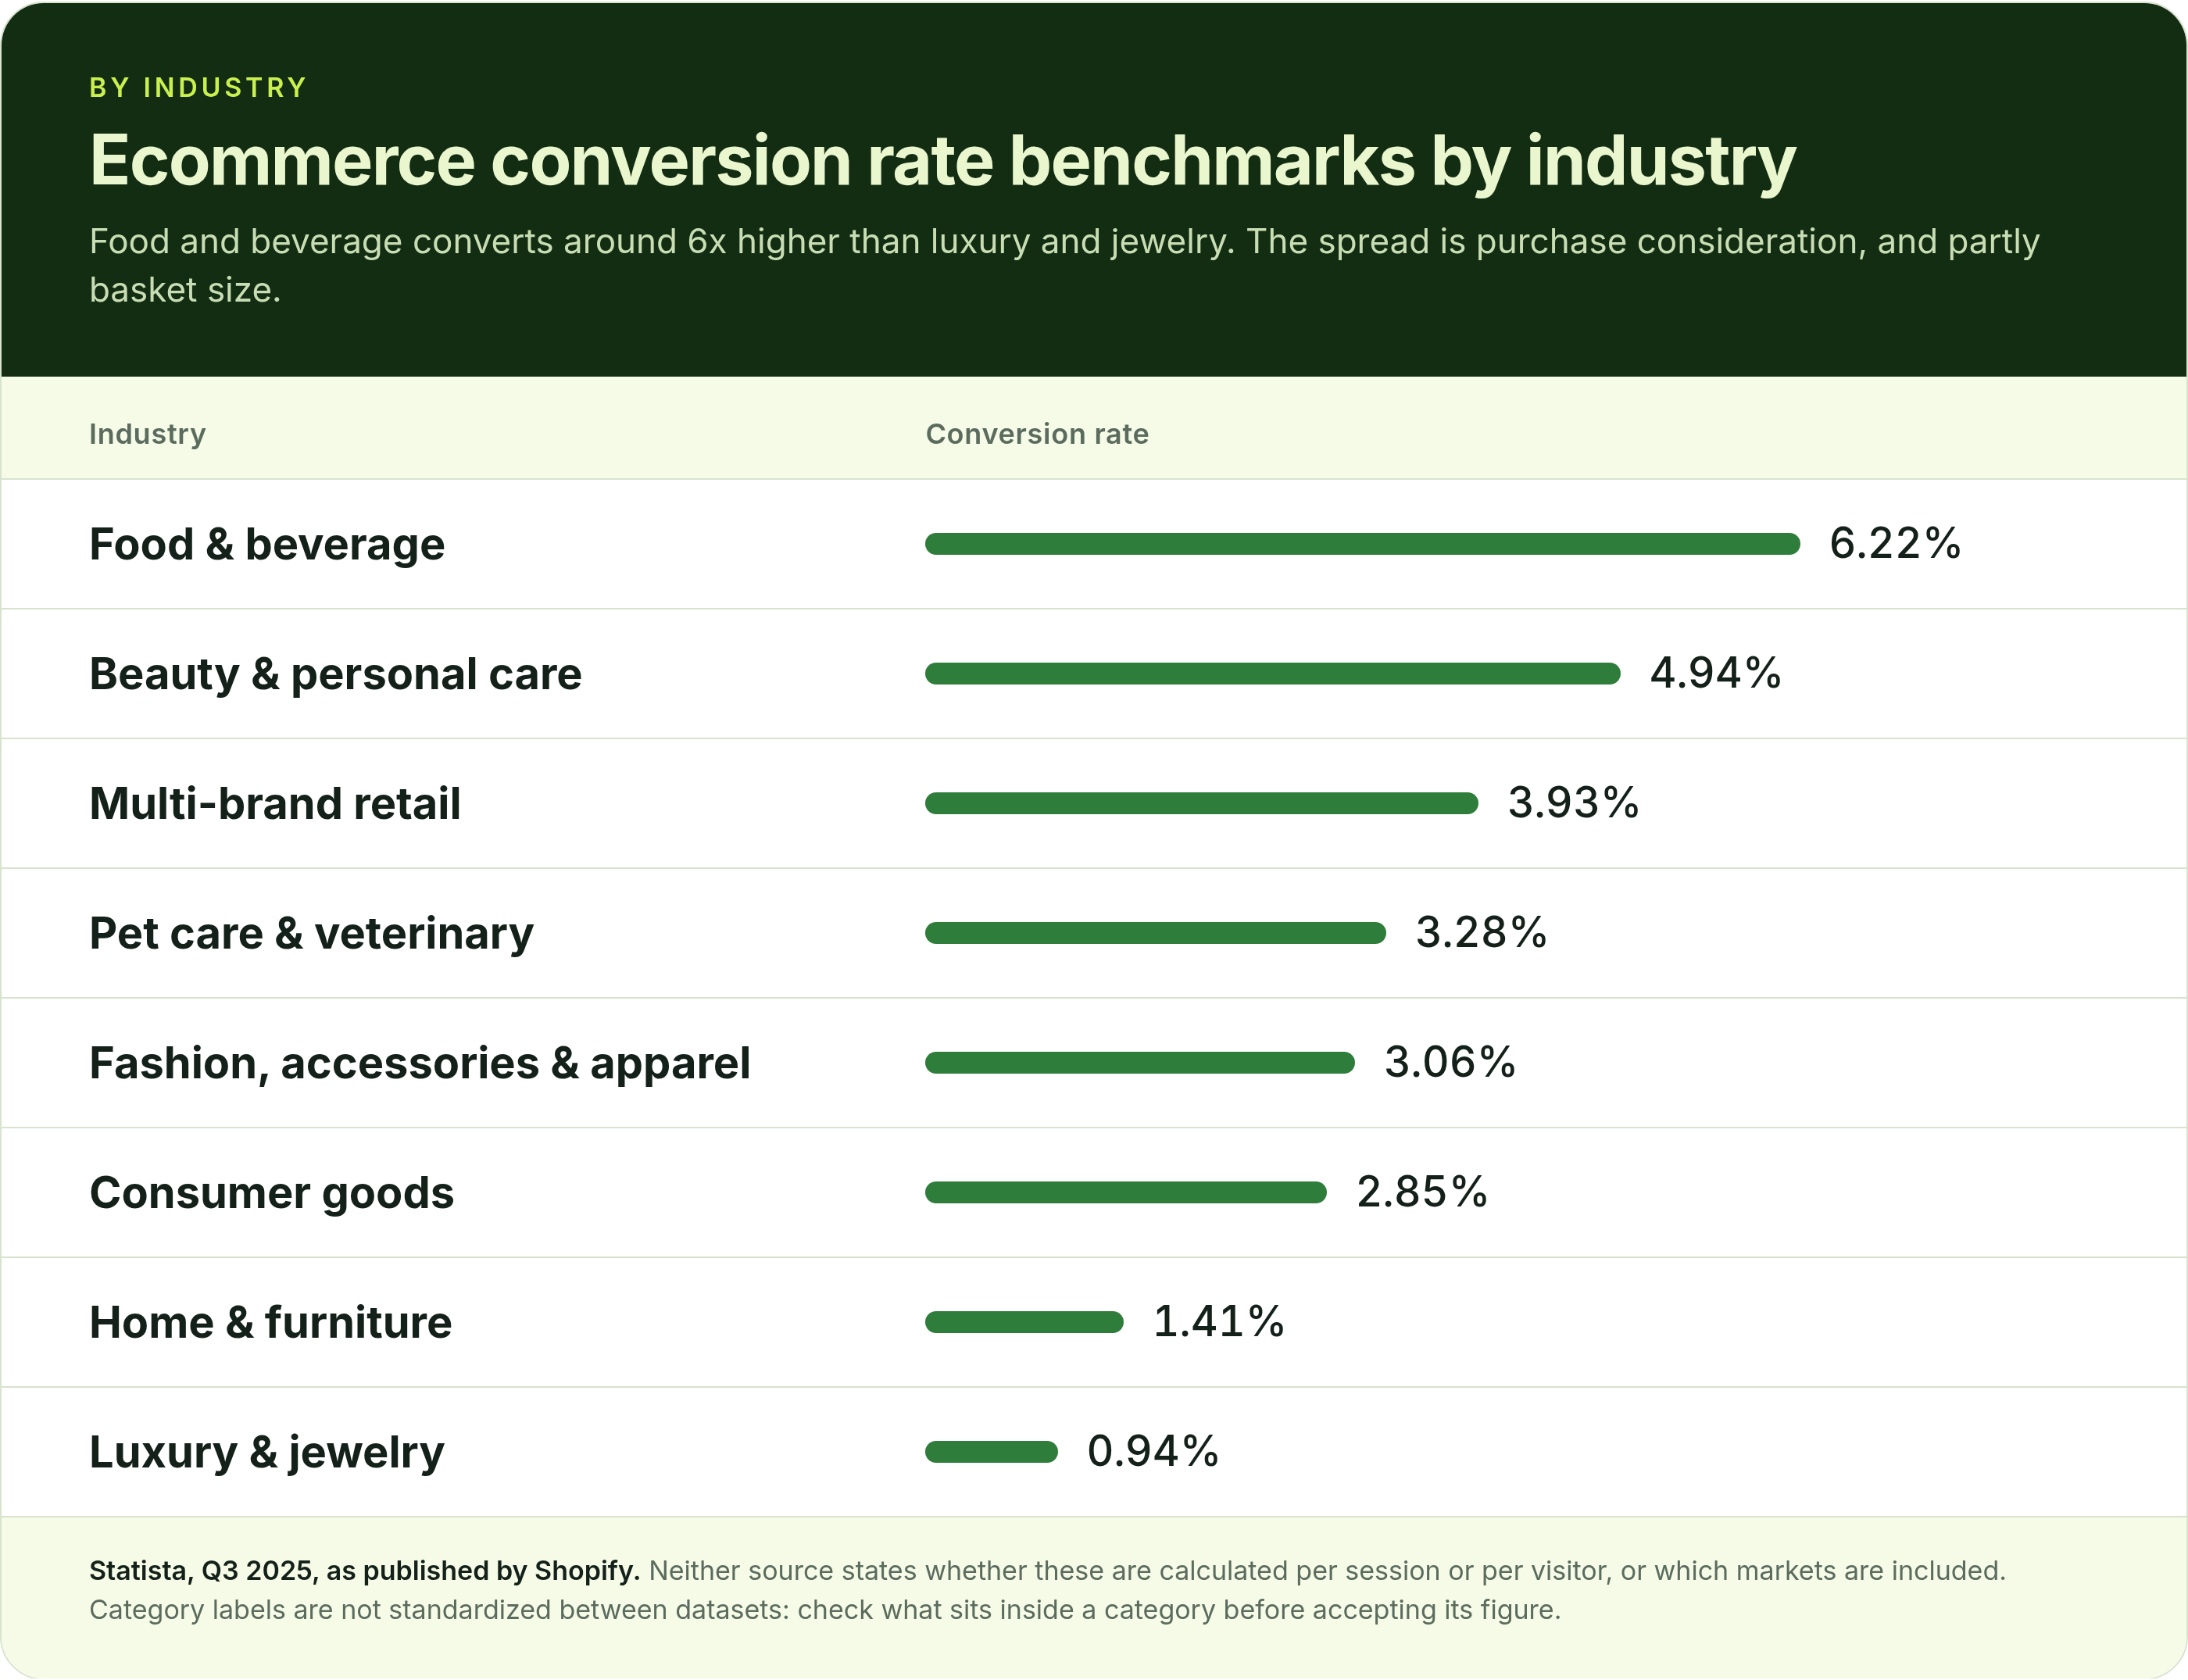
High-consideration, high-price catalogs. Furniture, fine jewelry, high-end equipment. At 0.94% for luxury and jewelry, that is the category working as intended. Judge revenue per session instead.
Wholesale or B2B on Shopify. Buyers research on the storefront and order through a rep, a portal or a purchase order. Your storefront conversion rate is measuring the wrong event.
Subscription-first businesses. One conversion produces twelve orders. A low first-purchase rate alongside a high retention rate is a strong business, and the headline conversion figure will never show it.
Deliberately broad top-of-funnel traffic. Awareness campaigns and informational search rankings buy visitors who were never going to purchase today. That is a strategy, not a leak, provided you are measuring what those visitors do on their second and third visit.
Two Stores at 2.1%, and How to Tell Them Apart
Store A converts 8% of product page views into carts, which is inside the normal range, then completes 38% of started checkouts. Store B converts 4% of product page views into carts, then completes 58% of checkouts.
Same headline number. Store A has a checkout problem: shipping costs appearing late, forced account creation, too few payment methods. Baymard Institute's 2025 survey puts unexpected extra costs at the top of the reasons non-browsers abandon, at 39%. Store B's checkout is fine and its product pages are not doing their job.
Fixing A's problem would do nothing for B. This is why benchmarking a single site-wide number, however carefully segmented, is only the first step.
Here is where the number breaks apart:
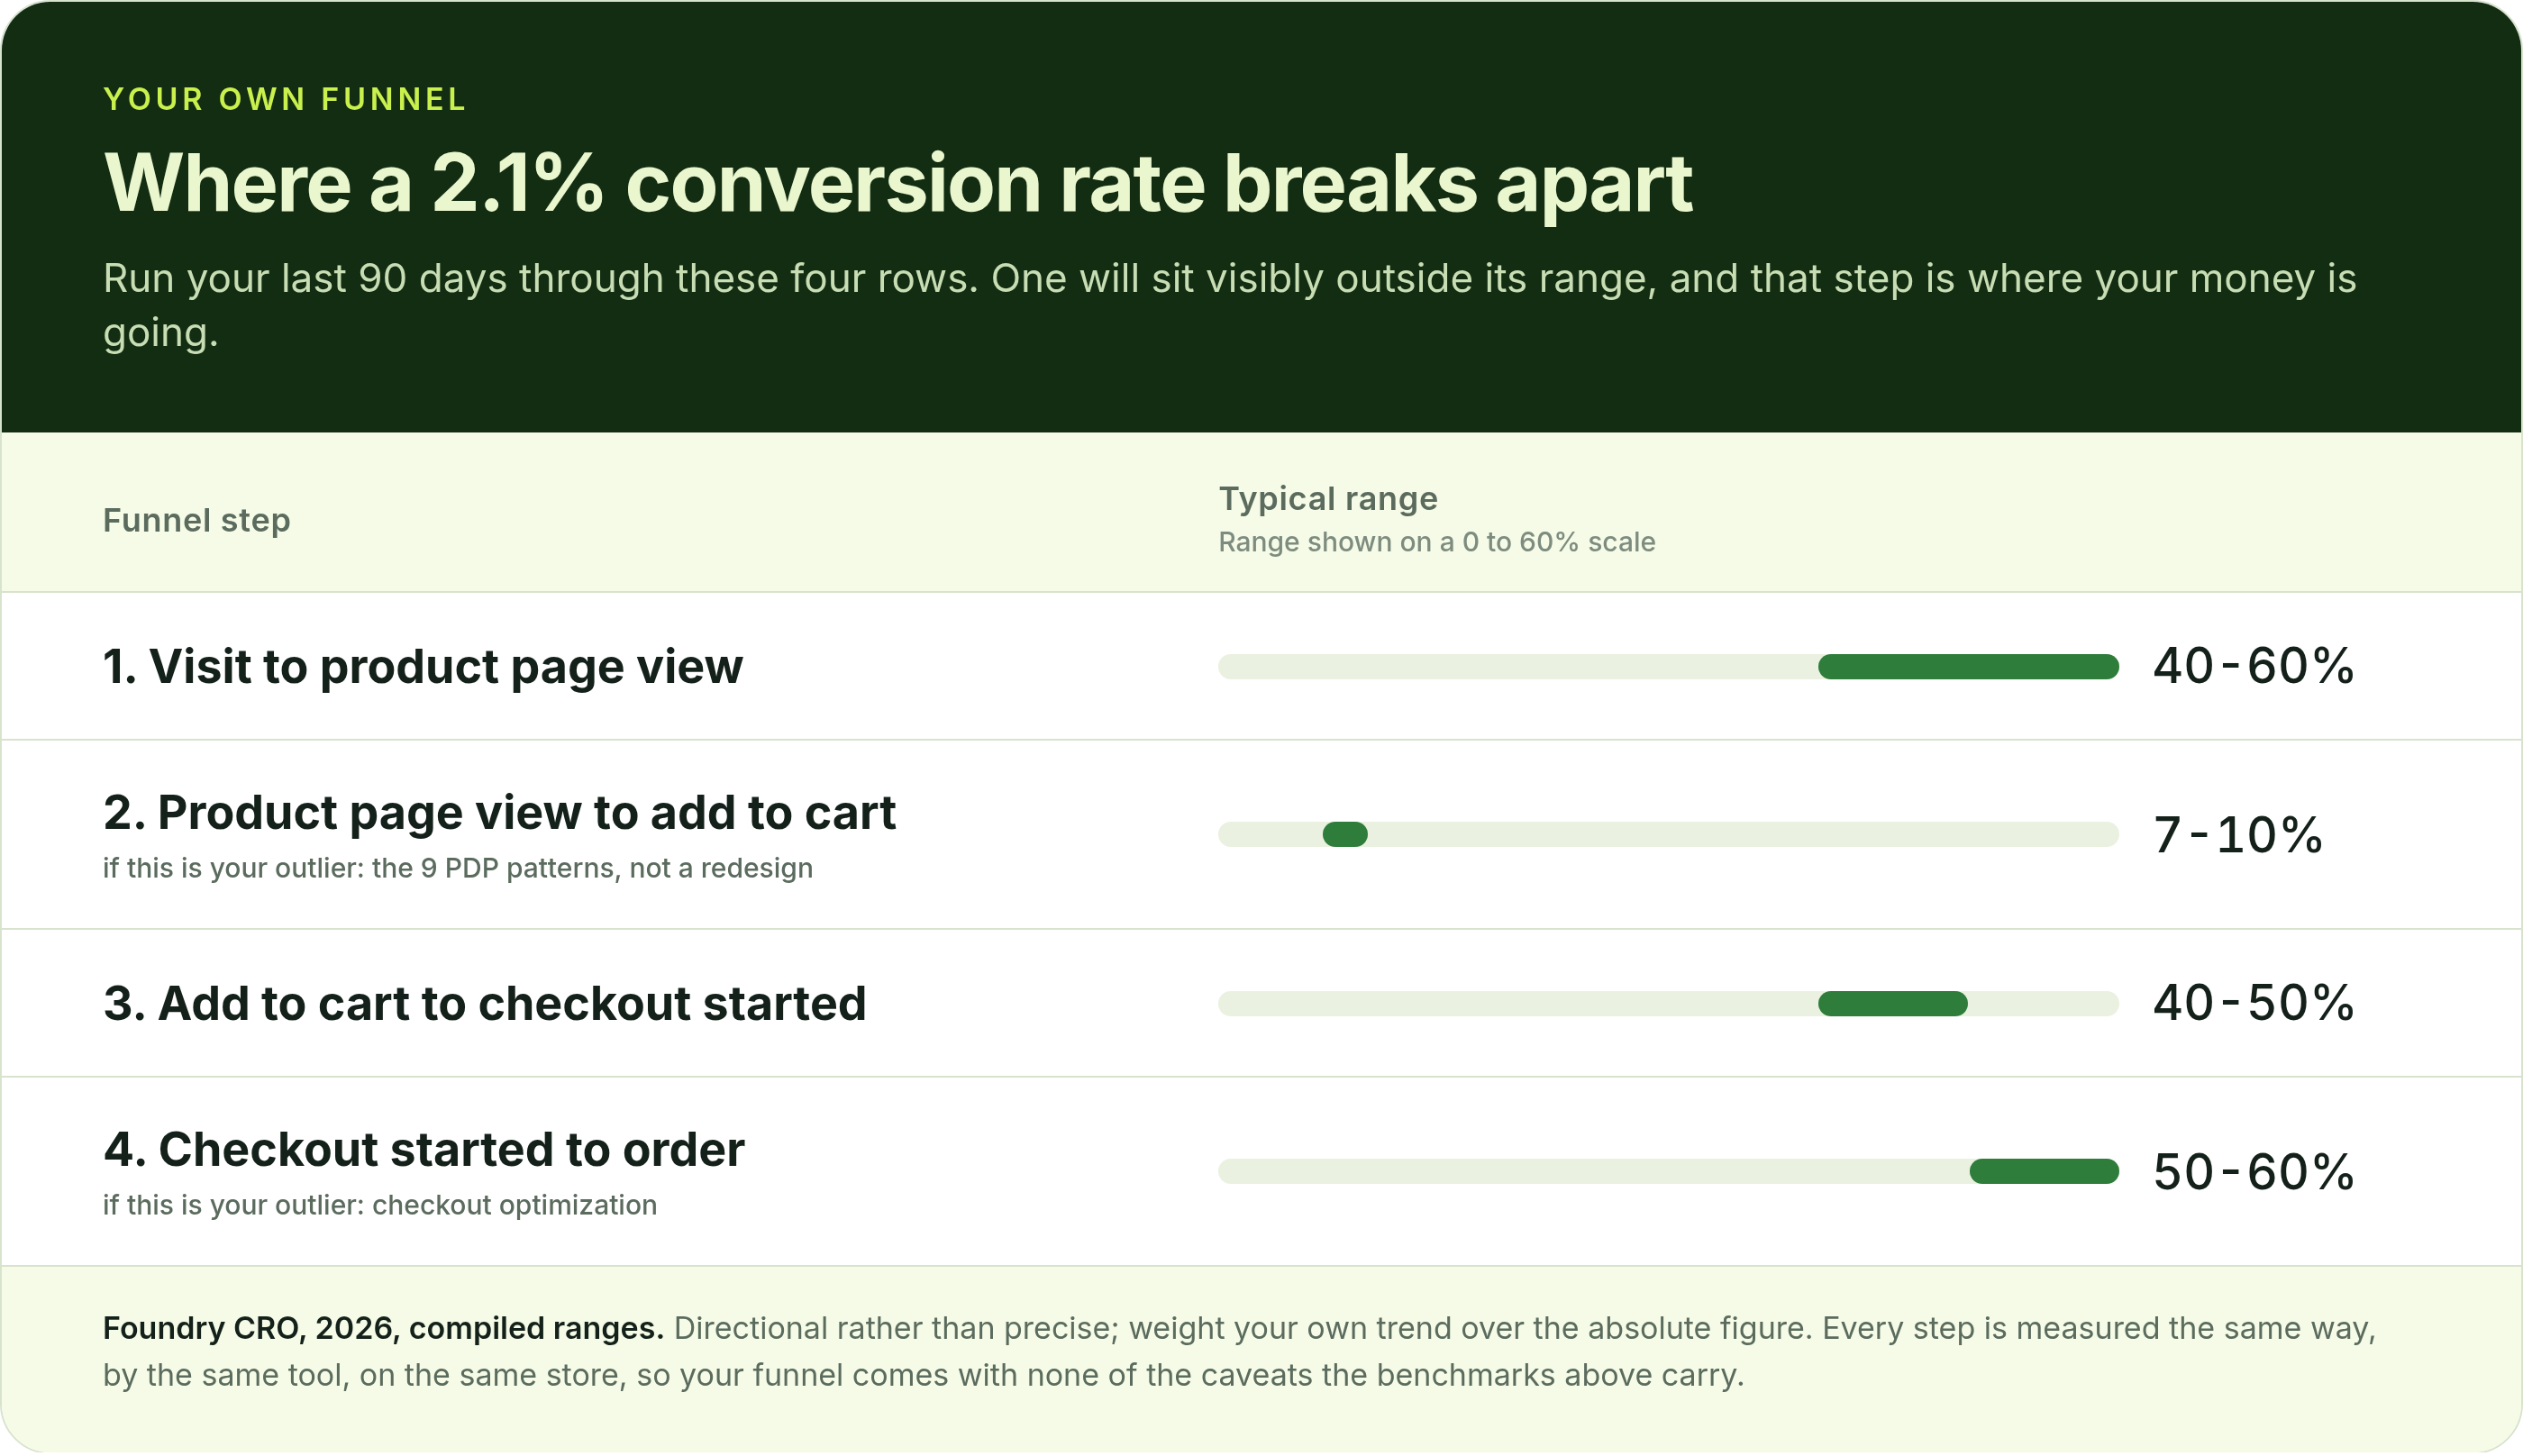
If your outlier is the second row, product page to add to cart, the fix is rarely a redesign. Start with the list we test from: 9 PDP Patterns We Test Before Spending Another Dollar on a Redesign. If it is the fourth row, start with our guide to Shopify checkout optimization.
Every figure on this page comes with a caveat about denominators, samples and dates. Your own funnel comes with none of them, because every step is measured the same way, by the same tool, on the same store.
So stop asking whether your number is normal. Ask which of those four rows is outside its range, and start there.
Glossary
Denominator. The base a conversion rate is divided by: sessions or unique visitors. Orders per visitor is always higher than orders per session on the same store, which is why undisclosed denominators make benchmarks incomparable.
Average order value (AOV). Net revenue divided by orders. Rises with price point and moves inversely with conversion rate, which is why the two are read together as revenue per session.
Revenue per session. Net revenue divided by sessions. Moves with conversion rate and average order value together, so it catches a conversion win that came out of discounting.
Desktop-to-mobile ratio. Desktop conversion rate divided by mobile conversion rate. Retail averages about 1.85x; a ratio far above that points to a mobile experience problem.
Funnel step rate. The share of visitors who progress from one stage to the next (visit to product page, product page to cart, cart to checkout, checkout to order). Measured consistently within one store, so it needs no external caveat.
Sources
• DTC Pages, Ecommerce Conversion Rate Benchmarks 2026, 21 Shopify stores, Q2 2026 (conversion and add-to-cart by AOV bracket, sessions denominator)
• Statista via Shopify, ecommerce conversion rate by industry, Q3 2025 (two cuts cited in the same Shopify article)
• Dynamic Yield, ecommerce benchmark index, 400+ brands (global average, cart abandonment by device)
• Contentsquare, 2026 Digital Experience Benchmark, retail
• ATTN Agency, 2026 DTC profitability benchmarks (conversion by traffic source)
• GrowthSuite, 2026 Shopify benchmarks by store size (compiled)
• Foundry CRO, 2026, funnel step ranges (compiled)
• Baymard Institute, reasons for cart abandonment
• Shopify Help Center, how the conversion rate metric is calculated

.webp)
.webp)
.webp)
.webp)
.webp)
.webp)


Do you have any questions left?
Here are the answers for you
Littledata's benchmark of 2,800 Shopify stores found an average of 1.4%, with 3.2% or above placing a store in the top 20% and 4.7% or above in the top 10%. Two caveats matter: it is an average rather than a median, so strong performers pull it upward, and the study dates from 2023. It is the most cited Shopify-specific figure available and a reasonable reference point, but it pools every store on the platform regardless of industry, traffic mix or size.
There is no answer to that without five more facts. For a luxury or furniture store, where the published category figure sits near 0.94-1.41%, 1.8% is strong. For a store with a $230 average order, where the median in DTC Pages' 21-store data is 0.79%, it is exceptional. For a store running mostly email traffic, where the channel benchmark is 5-8%, the same number is a serious problem. A store doing 80,000 monthly sessions is expected to convert lower than one doing 3,000. And desktop-heavy traffic converts roughly 1.85x better than mobile-heavy traffic. Establish your industry, average order value, traffic mix, device split and size before deciding whether 1.8% is good or bad.
Because consideration rises with price. A $40 consumable is bought in one session, often by a returning customer; a $250 item is researched across several sessions before the order, and each of those sessions lands in the denominator. In DTC Pages' 21-store Shopify dataset, stores under $60 AOV converted at a 2.42% median and stores above $200 at 0.79%, with add-to-cart rates falling from 6.43% to 3.46% across the same brackets. Benchmark against your own AOV bracket first, and judge tests on revenue per session so a conversion lift bought with a smaller basket does not read as a win.
Usually because the two numbers have different denominators. Shopify Analytics calculates conversion as orders divided by sessions. Most published benchmark tables do not state whether they used sessions or visitors, and orders-per-visitor always reports higher than orders-per-session on the same store. Sample composition and date add the rest: a study of 2,800 Shopify stores from 2023 and a global cross-sector figure from Q3 2025 are not measuring the same population or the same year.
Contentsquare's 2026 retail benchmark puts mobile at 2.0% against desktop at 3.7%. The more useful measure is the ratio between your own two devices, because both come from your dashboard and are calculated identically. Retail averages desktop converting about 1.85x better. If your desktop converts three or four times better than mobile, you have a mobile experience problem costing real money, since mobile typically carries around three quarters of traffic.
Find which funnel step is outside its typical range rather than optimizing the site-wide number. Compare your visit-to-product-page, product-page-to-cart, cart-to-checkout and checkout-to-order rates. One will stand out, and that step tells you whether the problem is discovery, product page persuasion or checkout friction. Each needs different work, and starting on the wrong one is the most common way a store spends a quarter without moving anything. The tactics for each step are in our guide to increasing Shopify conversion rate.
Yes, enough that older tables mislead. Contentsquare's 2026 retail benchmark reports overall conversion down 5.5% year over year, split unevenly at -8% on desktop and -3.5% on mobile. A table published two or three years ago will make a healthy store today look like it is underperforming, which is a good reason to check the publication date of any benchmark before acting on it, including this one.
Every plan includes complete care-driven CRO - what varies is testing capacity and analysis depth.
All Plans Include:
Onboarding (First 5 days):
- Founder interviews & business deep-dive
- Comprehensive technical website audit
- Customer psychology analysis (ICP, 5 WHYs, SWOT)
- AI-trained buyer personas creation
- Ad creatives audit
- Marketing ecosystem review
Ongoing (Continuous):
- Psychology-first hypothesis generation
- Conversion-focused UX/UI design
- Strategic copywriting
- Shopify development & implementation
- A/B testing & QA
- Transparent reporting & documentation
- Strategy meetings (weekly or bi-weekly)
What Changes by Tier:
- Tests per month: 2, 4, 6, or 8 A/B tests
- Meeting frequency: Bi-weekly (Starter) or Weekly (Growth+)
- Analysis depth: Post-purchase surveys, support analysis, inventory strategy, KPI planning, quarterly planning (varies by tier)
Bonus (Growth+): Comprehensive email marketing audit from specialist partners
Flexible plans give you complete control over costs. You pay for the essential CRO work - strategy, hypothesis generation, analysis, A/B test and project management - whilst design, development, and QA are billed separately at $70/hourly only when you need them.
This is perfect if you have an in-house design or development team, or if you want to manage exactly what gets built and when. You're not locked into paying for services you don't need.
Scale plans include everything - strategy, analysis, design, development, QA, and implementation - in one predictable monthly retainer. No surprises, no separate invoices, just complete care-driven CRO delivered autonomously.
Choose Flexible if: You have internal resources or want precise cost control
Choose Scale if: You want fully autonomous, hands-off CRO with everything included
Transparent pricing based on your monthly traffic.
We charge based on traffic volume because testing capacity and statistical significance directly correlate with session count. The more traffic you have, the faster we can run tests and deliver results.
Pricing:
- Starter (50K-75K sessions): $1,650/mo - 2 tests
- Growth (75K-150K sessions): $3,500/mo - 4 tests
- Scale (150K-350K sessions): $6,600/mo - 6 tests
- Enterprise (350K+ sessions): $10,700/mo - 8 tests
No long-term contracts. Cancel anytime.
Every plan includes our 30-day profitability guarantee.
Not sure which plan fits?
Book a discovery call - I'll help you find the perfect match for your business.
Our battle-tested frameworks and systems validate every hypothesis before we build.
Phase 1: Onboarding (First 5 days)
- Deep-dive into your business, customers, and psychology
- Comprehensive technical audit
- 25+ care-driven optimisation hypotheses
- Custom roadmap delivered
Phase 2: Operational (Continuous)
- Validate hypotheses through AI-trained buyer personas
- Ask: "Does this genuinely serve customer needs - not manipulate?"
- Design, develop, and implement winning tests
- Rigorous QA across all devices
- Launch and monitor
Phase 3: Ongoing Analysis (Monthly)
- Behavioural segmentation & data analysis
- Post-purchase survey analysis (Growth+ plans)
- Support ticket insights analysis (Growth+ plans)
- Inventory strategy (Growth+ plans)
- Monthly KPI planning (Growth+ plans)
- Quarterly strategic planning (Scale+ plans)
Yes - but as an addition to our battle-tested frameworks, not the foundation.
We've built a proprietary AI system that validates every hypothesis against your actual buyer personas before we build anything. This ensures we only create optimisations your customers will genuinely respond to.
How it works:
- Our frameworks identify conversion opportunities
- We generate psychology-first hypotheses
- AI-trained buyer personas validate each hypothesis
- We ask: "Does this genuinely serve customer needs—not manipulate?"
- Only validated hypotheses get built and tested
This approach achieves 84% test success rate vs 45% industry average - because we validate with your actual customers before building, not after.
AI enhances our care-driven methodology. It doesn't replace genuine customer understanding.
Simply upgrade to the next tier for more included tests and enhanced ongoing analysis.
We're completely flexible - scale up or down based on your business needs. No penalties, no long-term lock-ins.
Want to discuss expanding your plan? Your dedicated CRO manager can adjust your package anytime.
Yes. No long-term contracts. Cancel anytime.
We earn your business every single month through results - not by trapping you in contracts.
If we don't make you profitable within 30 days, you pay nothing more until we deliver. That's our guarantee.
Most clients stay because care-driven CRO compounds month after month - each winning test keeps generating revenue whilst new tests add even more. But you're never locked in.
We're confident our results will speak for themselves.
Zero micromanagement required. We operate completely autonomously.
We're an extension of your business - making decisions with your profit margins AND mission in mind, not billable hours.
Your involvement:
- Initial onboarding: 2-3 hours (interviews, strategy alignment)
- Weekly/bi-weekly meetings: 30-60 minutes (strategy updates, results review)
- Ad-hoc questions: Slack chat for quick questions
We handle everything else:
- Hypothesis generation
- Design and copywriting
- Development and implementation
- QA across all devices
- A/B test management
- Data analysis and reporting
You focus on running your business. We focus on adding $50K+ monthly to your revenue.
That's the partnership.
We integrate with your existing tools—no forced changes.
Analytics: Shopify Analytics, Microsoft Clarity, GA4
Testing: Intelligems
Management: ClickUp, Figma, Slack
Your data stays in your systems. We integrate seamlessly.
We sign NDAs before any work begins. Your data is protected - always.
Security measures:
- Non-Disclosure Agreement (NDA) signed upfront
- Limited access permissions (only what's necessary)
- Data stored in your systems (we don't migrate your data)
- Team access restricted to assigned personnel only
- Regular security audits
We treat your business like our own - that includes protecting your data like it's our own.
You maintain full control over all access permissions and can revoke them anytime.
Guaranteed profitability in 30 days. $50K+ monthly revenue boost within 60 days.
Tangible outcomes:
But more than numbers - you'll understand your customers deeply, remove friction authentically, and build genuine relationships that compound revenue month after month.
- Increased conversion rates (50-100%+ improvements common)
- Higher average order values
- Improved ROAS (return on ad spend)
- Enhanced customer lifetime value
- Sustainable, compounding revenue growth
Our 84% hypothesis success rate means tests consistently work.
Real client results:
- ForKeeps Merch: $2.3M added revenue (+70% conversion rate)
- Organic Muscle: 128% conversion rate increase
- CKitchen: $1.1M added revenue over 22 months
- Mayven Studios: 50% conversion increase in 2 months
For as long as care-driven CRO continues delivering massive ROI - which typically compounds over 6+ months.
Why long-term partnerships work:
- Each winning test keeps generating revenue permanently
- New tests stack on top of previous wins
- Deeper customer understanding leads to better hypotheses
- Compounding effects multiply over time
Typical timeline:
- Months 1-3: Foundation + initial wins ($50K+ monthly added)
- Months 4-6: Compounding effects visible (wins multiply)
- Months 7-12: Sustainable growth system established
- 12+ months: Category-leading conversion rates achieved
Most clients stay 12-24+ months because results compound. But there's no lock-in - cancel anytime.
We earn your business every month through genuine results, not contracts.
Three simple steps:
Step 1: Book a Discovery Call 30-minute conversation to discuss your traffic, goals, and biggest challenges. We'll explore if we're a good fit and map out your path to $50K+ monthly revenue growth.
Step 2: Get Your Free Audit We'll conduct a comprehensive CRO audit of your website, deliver 25+ psychology-first hypotheses, and show you exactly where your biggest revenue opportunities are.
Step 3: Choose Your Plan & Launch Select the plan that fits your traffic and business needs. We'll onboard you within 5 days and have your first A/B test live within 10 days.
Ready to grow with care-driven CRO?
Or have more questions? Email us: garyk@weblics.agency

Spending more on

Getting less back?
Your ads aren't broken. The store they land on is.
Send us your URL and we'll show you which leaks are eating your ad spend, and which one to fix first.

Just honest findings on your store, within 48h.