


Does Site Speed Affect Conversion Rate? The 3-Second Rule, Checked Rung by Rung
It has turned up in speed app pitches and cold emails ever since.
Hardly anyone quoting it mentions the footnote. The footnote is the best part, and we'll get to it on the second rung.
Why Speed Stats Don't Answer Your Question
The numbers that get quoted mostly answer an older question, or a different one. They've been forwarded so many times they read like an email chain where the attachment fell off around the fourth reply. Everyone's quoting the subject line.
So here they are, sorted by what each kind of evidence can actually prove. The bottom two rungs get quoted the most. The top one is free and already in your admin.
Rung 1: What People Say
On a store doing $200,000 a month, 7% is $14,000. Per second. That's a frightening number.
It comes from Aberdeen Group's December 2008 report, The Performance of Web Applications: Customers Are Won or Lost in One Second. More than 160 organizations took part in the survey behind it, and the report said each extra second of delay could cut page views by 11%, customer satisfaction by 16% and conversions by 7%.
So it's companies describing what they believed was happening on their own sites, eighteen months after the first iPhone went on sale. How much speed actually mattered, nobody measured.
The next rung has real data in it. It also has the footnote.
Rung 2: What Averages Show
Back to the footnote. The 53% came from aggregated Google Analytics data from about 3,700 mobile sites in March 2016. It appeared in the report behind that post, written for publishers who earn from ads. The same report put the average mobile site load at 19 seconds on 3G.
Read that with 2026 eyes. Three seconds was a target for a web where the average mobile page took nineteen.
Google did say it, and it was sound advice for publishers in 2016. Since 2020, though, Google has drawn a sharper line. Its Core Web Vitals call a page's main content good when it appears within 2.5 seconds for at least 75% of real visits. That measure is Largest Contentful Paint, or LCP, and Shopify already reports it for your store.
Portent's 2022 research is the modern version of this rung: more than 100 million page views across 20 sites, six of them ecommerce.
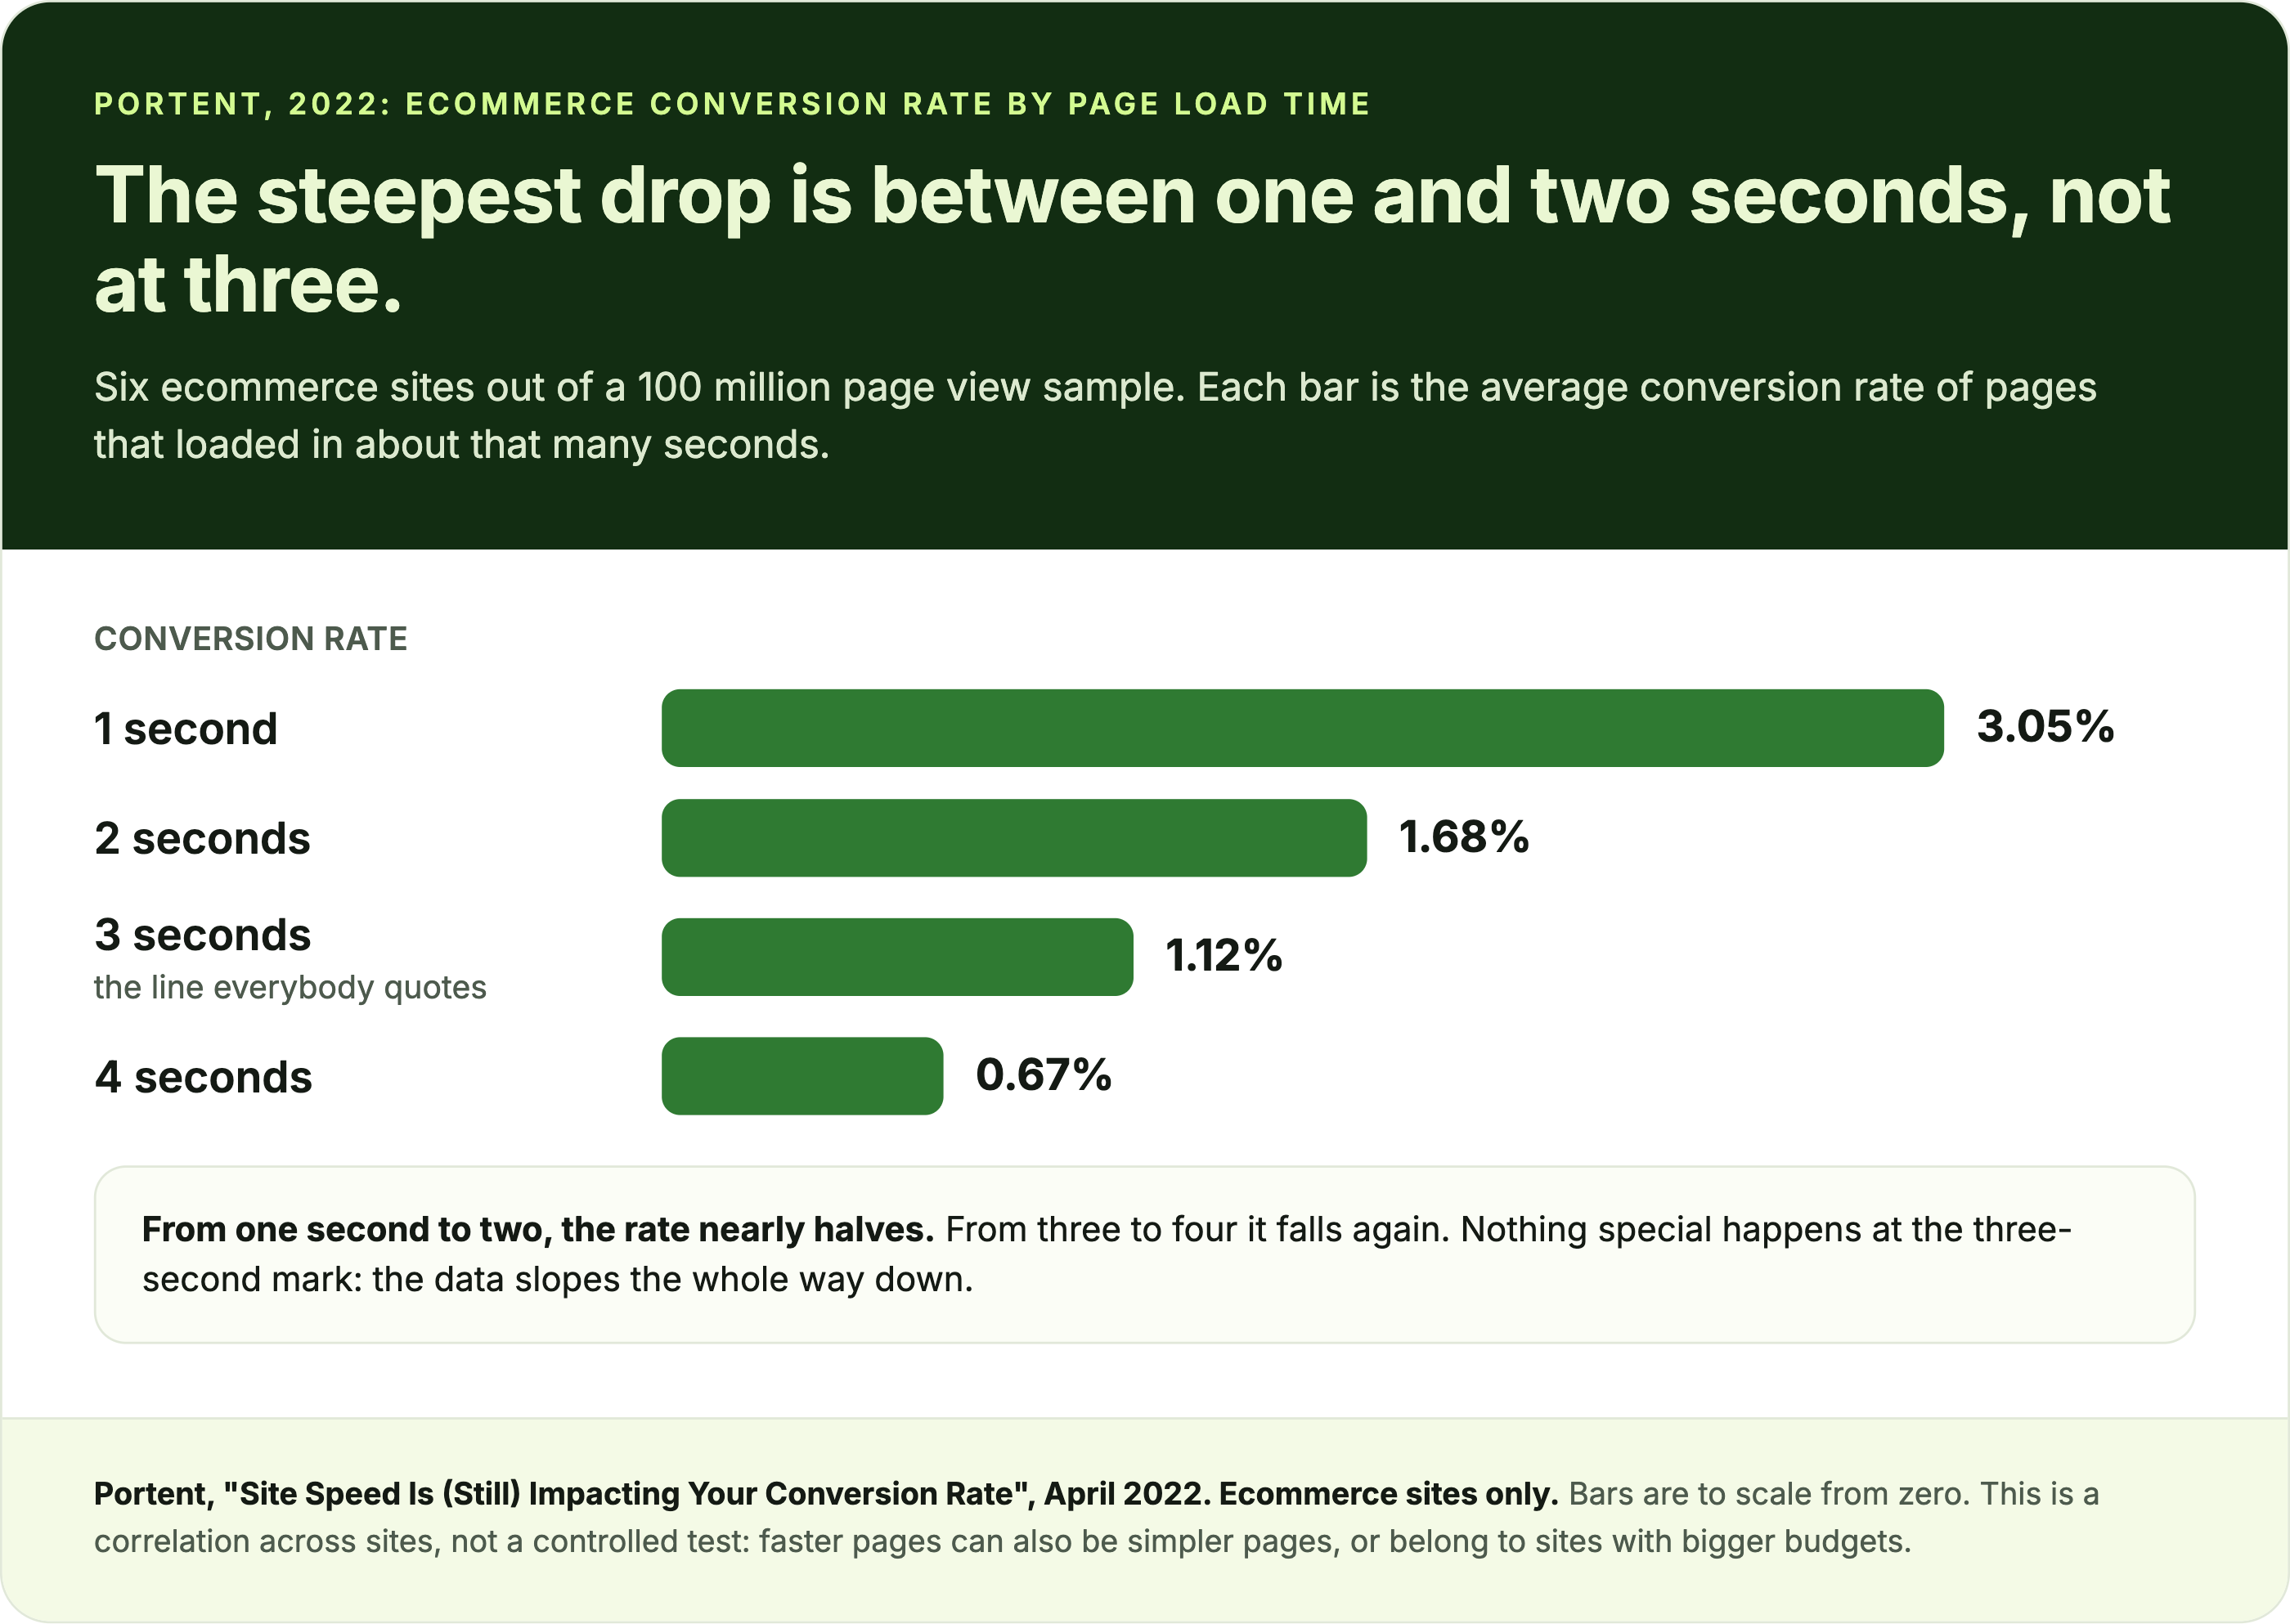
It's still a correlation. Faster pages can also be simpler pages, or belong to sites with bigger budgets. The same is true of the app-count data in our Shopify apps for conversion rate guide, where stores with more frontend apps score lower on mobile PageSpeed. To get closer to cause, you'd have to watch the same sites while their speed changed.
Somebody did.
Rung 3: The Same Sites, Watched Over Time
Google commissioned it, and Deloitte and the data agency 55 ran it across more than 30 million sessions in late 2019. Retail average order value rose 9.2% alongside the conversion lift, and the brands were screened for planned site changes and A/B tests before the study began.
Watching the same sites removes a lot of the noise from rung 2. It still isn't a test. All four metrics moved together, so there's no telling which one did the work, and one of them, First Meaningful Paint, was dropped from Google's own Lighthouse in 2020 as "too variant."
Take 8.4% as proof the link is real. Just don't multiply it by your revenue and call it a forecast.
For cause, you need a controlled test. Two companies published one, and one of them is the paradox at the top of this page.
Rung 4: Controlled Tests
Vodafone's test, published in 2021, ran on a landing page getting around 34,000 visits a day per version. The optimized version cut LCP by 31%, from 8.3 seconds to 5.7, and sold 8% more.
Both versions were far past three seconds. If three seconds were a cliff, a page still taking 5.7 would be past saving. It came out 8% of sales ahead.
Rakuten 24, a Japanese online store for everyday goods, ran a month-long test on one high-traffic landing page. Revenue per visitor rose 53% and conversion rate 33%.
The detail most retellings skip: in the mobile load test, the optimized version finished only 0.4 seconds sooner, 1.6 seconds against 2.0. The biggest measured change was that the page stopped moving. Layout shift improved by 93%.
From the buyer's side, that's a phone on a crowded train, one bar of signal, and the Add to cart button sliding down half an inch just as a thumb gets to it.
Two limits before you take these to a meeting. Both case studies come from Google, which has an interest in you caring about speed, and both are single pages at single companies, a telecom and a household goods store. They settle whether speed can move sales. Sizing it for your store takes the last rung.
Rung 5: Your Own Store
Go to Analytics, then Reports, and open Largest Contentful Paint: Over Time. It shows the 75th percentile, the same line Google uses, so 2.5 seconds or less is good. Then open Largest Contentful Paint: Page Type and look at product pages on their own. When the line jumps, check the numbered markers on the chart first. They show app installs and theme updates.
One catch makes this urgent. The report keeps only 90 days. If you installed an app or changed themes about three months ago, that stretch is about to roll off the chart. Take a screenshot this week.
Now the honest part. At Weblics we've never run a clean A/B test on speed alone. Speed work on a live store usually ships to everyone at once, so there's no control group, and there isn't one in our testing log. That puts our own evidence on rung 3, the same rung as Deloitte's, and it's why we won't hand you a client number here that would only be a before and after dressed up as a result.
What we can give you is the before and after to build for yourself, because it takes two numbers and a calendar. Write down your product pages' LCP at the 75th percentile from Shopify's report, and your product page conversion rate for the same four weeks. Make the speed change. Wait four weeks. Write both numbers down again, with the app installs, theme edits, promotions and ad spend changes from those weeks next to them.
Season and ad spend move those numbers too. Read the second pair as consistent with the first, not caused by it. That's the limit of rung 3, and it's a limit worth knowing before somebody sells you a speed fix with a conversion forecast attached.
Red Flags: When a Speed Number Is Lying to You
If yours is red, you're typical. Hyperspeed's April 2026 lab scan of more than a thousand Shopify stores averaged 30, and Hyperspeed sells a speed app, which is worth knowing when you read that. Either way, the score isn't measuring your buyers. PageSpeed runs one emulated phone on a throttled connection and makes a forecast. Shopify's report is closer to looking out the window.
It's also easy to fake. In March 2024, Shopify's performance team reported that almost 15% of extensions promising one-click speed optimization were gaming the result. Some serve the testing tool a stripped page. Others paint an invisible element that gets timed as LCP instead of your product photo.
Signs a number is lying to you:
• The score jumped overnight after an install, and nothing feels different on your phone.
• PageSpeed Insights and a separate Lighthouse run disagree by 20 points or more, a warning sign Shopify lists itself.
• The LCP element in the report is something you can't see, like a transparent image.
• The lab score improved while the real visitor report didn't.
A speed app that only moves the score bills you every month for a number that lives in a simulator. The report that measures your actual buyers is free and already in your admin.
Somewhere right now, someone is on your product page over hotel wifi, looking at a gray box where your best photo will be in a second or two. That second costs you something, and the report you just opened is the only place that says how much.
Once you know what the first screen of your product page costs in load time, the next question is what it should hold. Our product page optimization checklist is the list we start from on a new store.
One loose end from rung 4. Rakuten's biggest gain came from a page that stopped jumping, and on Shopify some of the elements that can arrive late and push a page around are the ones meant to build trust, like review stars and UGC carousels. Where to put them so they don't shove the page is in where to add reviews on Shopify.
Three seconds was never your number. Yours has been in your admin the whole time.
Sources
• Aberdeen Group, "The Performance of Web Applications: Customers Are Won or Lost in One Second", December 2008 (160+ organizations, 7% conversions per second of delay)
• Portent, "Site Speed Is (Still) Impacting Your Conversion Rate", 2022 (100 million page views, 20 sites, 6 ecommerce)
• Deloitte and 55 for Google, "Milliseconds Make Millions", 2020 (37 brands, 30 million sessions, 8.4% retail conversion lift per 0.1 second)
• web.dev case study, Vodafone, 2021 (LCP 8.3 to 5.7 seconds, 8% more sales)
• web.dev case study, Rakuten 24, 2020 (revenue per visitor +53%, conversion +33%, layout shift improved 93%)
• Google, Core Web Vitals, Largest Contentful Paint threshold (2.5 seconds at the 75th percentile)
• Google, Lighthouse 6.0 release notes, May 2020 (First Meaningful Paint deprecated as too variant)
• Shopify Help Center, web performance dashboard and reports (Over Time and Page Type reports, 75th percentile, event annotations, 90-day retention)
• Performance at Shopify, "Shopify's new web performance dashboard with real user insights", January 2024 (Lighthouse-based speed score replaced)
• Performance at Shopify, "Don't get scammed by fake performance experts and apps", March 2024 (almost 15% of one-click optimization extensions gaming scores, 20-point gap warning)
• Hyperspeed, "We Audited 1,166 Shopify Stores: Why the Average PageSpeed Score Is Only 30", April 2026
• Weblics test log (Intelligems): no speed-only A/B test on record across client accounts, checked September 2026

.webp)
.webp)
.webp)
.webp)
.webp)
.webp)


Do you have any questions left?
Here are the answers for you
Yes. Controlled A/B tests published by Google show it: a Vodafone landing page with 31% faster LCP produced 8% more sales, and Rakuten 24's optimized page converted 33% better. How much speed matters on a particular store depends on the page and the visitors, so the most useful number is the real visitor report in your Shopify admin.
It comes from a 2016 Google report written for publishers, which said 53% of mobile visits were abandoned when a page took longer than three seconds to load, based on Google Analytics data from about 3,700 mobile sites. The same report measured the average mobile site load at 19 seconds on 3G. Google's current benchmark is Largest Contentful Paint within 2.5 seconds for at least 75% of visits.
The widely quoted 7% comes from a 2008 Aberdeen Group survey of about 160 organizations, which asked companies to report their own experience. In Portent's 2022 data from six ecommerce sites, conversion rates fell from 3.05% at one second to 0.67% at four, with the steepest drop between one and two seconds. That's a correlation, so it can't be read as a price per second.
Not by itself. A score around 30 is typical: Hyperspeed's April 2026 lab scan of more than a thousand Shopify stores averaged 30. The score is a lab simulation, and Shopify stopped using a Lighthouse-based speed score in 2024. The web performance reports under Analytics, then Reports, measure your real visitors.
By Google's Core Web Vitals, which Shopify reports for every store with enough traffic: Largest Contentful Paint within 2.5 seconds, Interaction to Next Paint under 200 milliseconds and Cumulative Layout Shift under 0.1, each at the 75th percentile of real visits.
Some make real improvements and some only move the score. In 2024, Shopify's performance team found that almost 15% of extensions promising one-click speed optimization were gaming the result. The fair test for any app is Shopify's real visitor report.
Every plan includes complete care-driven CRO - what varies is testing capacity and analysis depth.
All Plans Include:
Onboarding (First 5 days):
- Founder interviews & business deep-dive
- Comprehensive technical website audit
- Customer psychology analysis (ICP, 5 WHYs, SWOT)
- AI-trained buyer personas creation
- Ad creatives audit
- Marketing ecosystem review
Ongoing (Continuous):
- Psychology-first hypothesis generation
- Conversion-focused UX/UI design
- Strategic copywriting
- Shopify development & implementation
- A/B testing & QA
- Transparent reporting & documentation
- Strategy meetings (weekly or bi-weekly)
What Changes by Tier:
- Tests per month: 2, 4, 6, or 8 A/B tests
- Meeting frequency: Bi-weekly (Starter) or Weekly (Growth+)
- Analysis depth: Post-purchase surveys, support analysis, inventory strategy, KPI planning, quarterly planning (varies by tier)
Bonus (Growth+): Comprehensive email marketing audit from specialist partners
Flexible plans give you complete control over costs. You pay for the essential CRO work - strategy, hypothesis generation, analysis, A/B test and project management - whilst design, development, and QA are billed separately at $70/hourly only when you need them.
This is perfect if you have an in-house design or development team, or if you want to manage exactly what gets built and when. You're not locked into paying for services you don't need.
Scale plans include everything - strategy, analysis, design, development, QA, and implementation - in one predictable monthly retainer. No surprises, no separate invoices, just complete care-driven CRO delivered autonomously.
Choose Flexible if: You have internal resources or want precise cost control
Choose Scale if: You want fully autonomous, hands-off CRO with everything included
Transparent pricing based on your monthly traffic.
We charge based on traffic volume because testing capacity and statistical significance directly correlate with session count. The more traffic you have, the faster we can run tests and deliver results.
Pricing:
- Starter (50K-75K sessions): $1,650/mo - 2 tests
- Growth (75K-150K sessions): $3,500/mo - 4 tests
- Scale (150K-350K sessions): $6,600/mo - 6 tests
- Enterprise (350K+ sessions): $10,700/mo - 8 tests
No long-term contracts. Cancel anytime.
Every plan includes our 30-day profitability guarantee.
Not sure which plan fits?
Book a discovery call - I'll help you find the perfect match for your business.
Our battle-tested frameworks and systems validate every hypothesis before we build.
Phase 1: Onboarding (First 5 days)
- Deep-dive into your business, customers, and psychology
- Comprehensive technical audit
- 25+ care-driven optimisation hypotheses
- Custom roadmap delivered
Phase 2: Operational (Continuous)
- Validate hypotheses through AI-trained buyer personas
- Ask: "Does this genuinely serve customer needs - not manipulate?"
- Design, develop, and implement winning tests
- Rigorous QA across all devices
- Launch and monitor
Phase 3: Ongoing Analysis (Monthly)
- Behavioural segmentation & data analysis
- Post-purchase survey analysis (Growth+ plans)
- Support ticket insights analysis (Growth+ plans)
- Inventory strategy (Growth+ plans)
- Monthly KPI planning (Growth+ plans)
- Quarterly strategic planning (Scale+ plans)
Yes - but as an addition to our battle-tested frameworks, not the foundation.
We've built a proprietary AI system that validates every hypothesis against your actual buyer personas before we build anything. This ensures we only create optimisations your customers will genuinely respond to.
How it works:
- Our frameworks identify conversion opportunities
- We generate psychology-first hypotheses
- AI-trained buyer personas validate each hypothesis
- We ask: "Does this genuinely serve customer needs—not manipulate?"
- Only validated hypotheses get built and tested
This approach achieves 84% test success rate vs 45% industry average - because we validate with your actual customers before building, not after.
AI enhances our care-driven methodology. It doesn't replace genuine customer understanding.
Simply upgrade to the next tier for more included tests and enhanced ongoing analysis.
We're completely flexible - scale up or down based on your business needs. No penalties, no long-term lock-ins.
Want to discuss expanding your plan? Your dedicated CRO manager can adjust your package anytime.
Yes. No long-term contracts. Cancel anytime.
We earn your business every single month through results - not by trapping you in contracts.
If we don't make you profitable within 30 days, you pay nothing more until we deliver. That's our guarantee.
Most clients stay because care-driven CRO compounds month after month - each winning test keeps generating revenue whilst new tests add even more. But you're never locked in.
We're confident our results will speak for themselves.
Zero micromanagement required. We operate completely autonomously.
We're an extension of your business - making decisions with your profit margins AND mission in mind, not billable hours.
Your involvement:
- Initial onboarding: 2-3 hours (interviews, strategy alignment)
- Weekly/bi-weekly meetings: 30-60 minutes (strategy updates, results review)
- Ad-hoc questions: Slack chat for quick questions
We handle everything else:
- Hypothesis generation
- Design and copywriting
- Development and implementation
- QA across all devices
- A/B test management
- Data analysis and reporting
You focus on running your business. We focus on adding $50K+ monthly to your revenue.
That's the partnership.
We integrate with your existing tools—no forced changes.
Analytics: Shopify Analytics, Microsoft Clarity, GA4
Testing: Intelligems
Management: ClickUp, Figma, Slack
Your data stays in your systems. We integrate seamlessly.
We sign NDAs before any work begins. Your data is protected - always.
Security measures:
- Non-Disclosure Agreement (NDA) signed upfront
- Limited access permissions (only what's necessary)
- Data stored in your systems (we don't migrate your data)
- Team access restricted to assigned personnel only
- Regular security audits
We treat your business like our own - that includes protecting your data like it's our own.
You maintain full control over all access permissions and can revoke them anytime.
Guaranteed profitability in 30 days. $50K+ monthly revenue boost within 60 days.
Tangible outcomes:
But more than numbers - you'll understand your customers deeply, remove friction authentically, and build genuine relationships that compound revenue month after month.
- Increased conversion rates (50-100%+ improvements common)
- Higher average order values
- Improved ROAS (return on ad spend)
- Enhanced customer lifetime value
- Sustainable, compounding revenue growth
Our 84% hypothesis success rate means tests consistently work.
Real client results:
- ForKeeps Merch: $2.3M added revenue (+70% conversion rate)
- Organic Muscle: 128% conversion rate increase
- CKitchen: $1.1M added revenue over 22 months
- Mayven Studios: 50% conversion increase in 2 months
For as long as care-driven CRO continues delivering massive ROI - which typically compounds over 6+ months.
Why long-term partnerships work:
- Each winning test keeps generating revenue permanently
- New tests stack on top of previous wins
- Deeper customer understanding leads to better hypotheses
- Compounding effects multiply over time
Typical timeline:
- Months 1-3: Foundation + initial wins ($50K+ monthly added)
- Months 4-6: Compounding effects visible (wins multiply)
- Months 7-12: Sustainable growth system established
- 12+ months: Category-leading conversion rates achieved
Most clients stay 12-24+ months because results compound. But there's no lock-in - cancel anytime.
We earn your business every month through genuine results, not contracts.
Three simple steps:
Step 1: Book a Discovery Call 30-minute conversation to discuss your traffic, goals, and biggest challenges. We'll explore if we're a good fit and map out your path to $50K+ monthly revenue growth.
Step 2: Get Your Free Audit We'll conduct a comprehensive CRO audit of your website, deliver 25+ psychology-first hypotheses, and show you exactly where your biggest revenue opportunities are.
Step 3: Choose Your Plan & Launch Select the plan that fits your traffic and business needs. We'll onboard you within 5 days and have your first A/B test live within 10 days.
Ready to grow with care-driven CRO?
Or have more questions? Email us: garyk@weblics.agency

Spending more on

Getting less back?
Your ads aren't broken. The store they land on is.
Send us your URL and we'll show you which leaks are eating your ad spend, and which one to fix first.

Just honest findings on your store, within 48h.